


 By Staff
December 15th, 2021
BURLINGTON, ON
Community Lens is prepared by Community Development Halton to disseminate and interpret important community data as it becomes available.
Traditionally, across Canada, the month of December is the busiest fundraising period for nonprofits and charities, kicking off with the post-Thanksgiving fundraising drive on Giving Tuesday (the first Tuesday after American Thanksgiving, which was the 30th of November this year). A study by Imagine Canada, for example, found that “[m]any charities typically receive about 40 per cent of their donations in the last six-to-eight weeks of the year.”
In 2017, the nonprofit and charity sector contributed 8.5% to Canada’s GDP, if we were to include “volunteer activities – which are important for the non-profit sector but not included in standard macroeconomic measures – [they] would have added a further $41.8 billion to the economy in 2013… representing 22.3% of non-profit GDP that year.” 2 (These data may be underestimates of the real scale of the nonprofit sector in Canada, for a useful brief overview of this argument, one should read ‘The non-profit sector’s ongoing data deficit’ in The Philanthropist Journal. ) It is fair to say that the month of December not only has a significant impact on the nonprofit and charity sector planning activities for the year ahead, but a wider impact on the health of Canada’s economy.
To mark Giving Tuesday and the month of fundraising that follows, this Community Lens will analyze Halton residents’ behaviour around charitable donations and compare it with wider Ontario and Canadian trends.
 A 2018 Community Lens issue observed that “the amount of charitable donations and the number of donors” were falling across the country.
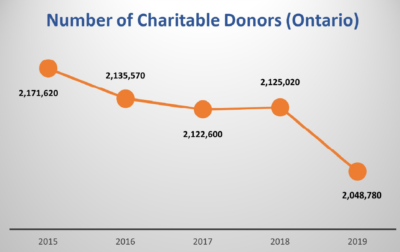
Looking at the latest available data for 2019, and comparing it with the years between 2015, this downward trend continued. In Ontario in 2015, according to tax filer data, there were 2,171,620 charitable donors and 9,859,860 tax filers in the province. As the data in this graph demonstrates, the number of charitable donors continued to fall in Ontario, except for one year during this period in which the number of charitable donors slightly increased from 2,122,600 in 2017 to 2,125,020 in 2018.
The total number of charitable donors fell from 2,171,620 donors in 2015 to 2,048,780 in 2019, which is a decrease of 122,840 individuals. What is more concerning is that the number of individual donors fell during a time when there were increases in the number of tax filers: there were 476,800 more tax filers in 2019 (10,336,660) compared to 2015 (9,859,860). These trends that we are seeing in Ontario are being replicated at a national level.
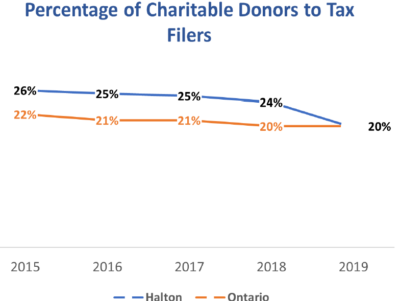 Presenting these data in another way, this next graph shows that, from 2015 until 2018, Halton was outperforming the province for the percentage of tax filers who are charitable donors. In 2019, there was a fall of 4% in Halton to leave the Region and province on the same proportion of charitable donors to tax filers – at 20%. (For the purposes of clarity and readability the Canadian trendline for this period has been omitted from this graph; for interested readers, its behaviour is closer to Ontario rather than Halton trends: 2015: 21%; 2016:20%; 2017: 20%; 2018: 19%; 2019: 19%.)
Although the percentage of charitable donors in Halton fell by 4% from 2018 to 2019, the average charitable donation in the Region rose from 2015 – 2019. In 2015, the average charitable donation was $1,466 and in 2019 it was $1,822 – an increase of $355, or 24%. 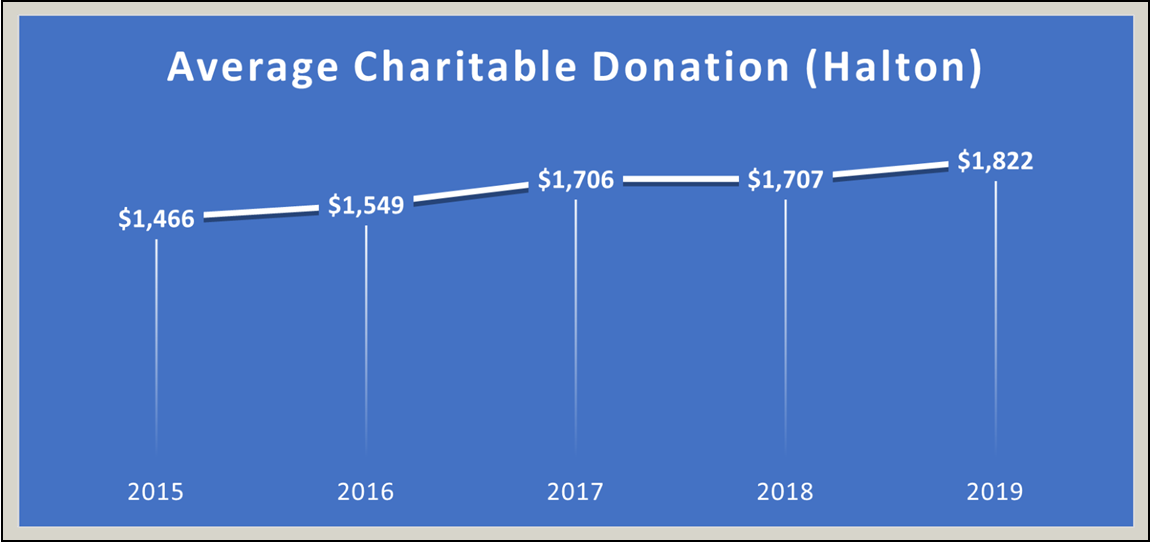 Despite the other worrying trends that are being witnessed elsewhere in the data, such as average age increasing and the percentage of charitable donors to tax filers falling, the average Halton charitable donation for this period is beating the rate of inflation by a significant amount: from 2015 to 2019 the average annual inflation rate was 1.80%.
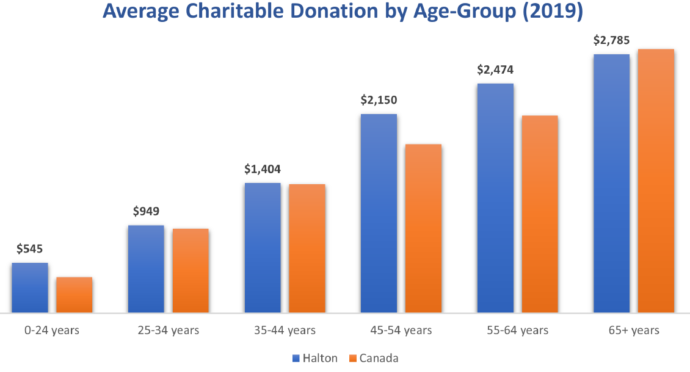
Looking at the 2019 data, the average Halton tax filer gives more in donations than the national average across all age categories, except in the 65+ cohort. In the 0-24 years category,
Halton individuals in 2019 gave an average of $545, compared to a national figure of $390. In the 35-44 years age category, residents in Halton gave $1,404 in 2019, just over the comparative national figure of $1,390.00. In 2019, the only age cohort where Halton residents gave below the national average was in the 65+ years: the national average for this age category was $2,840, while Halton residents gave on average just under this, at $2,785, in 2019.
 The average age of charitable donors continues to rise in Ontario and Halton. However, the average age of charitable donors’ increase is more acute in Ontario. In 2015 the average age was 55, while four years later, in 2019, the average age increased by 4 years, to 59, for the province. In the same period in Halton, the average age only increased by 1 year, from 55.5 to 56.5. The national average age of a
charitable donor was 54 in 2015 and remained consistently at 55 from 2016-2019.
This Community Lens revealed informative findings about charitable donation trends in Halton, Ontario, and Canada.
Overall, Halton continues to perform better than provincial and national trends in several areas. In 2019, for example, Halton, across all age groups apart from the 65+ age cohort, gave more in charitable donations than the national average. This Lens also showed that the average charitable donation increased by 24% in Halton between 2015-2019, far outstripping the compounded inflation of 7.2% for that period.
However, across the same period, the percentage of charitable donors to tax filers in Halton fell from 26% in 2015 to 20% in 2019. In other words, as charitable donations increased in Halton, they were coming from a shrinking pool of individuals.
Furthermore, this Lens showed there is an upward trend in the average age of charitable donors, with Ontario’s 4-year average age increase the most acute. A lower average charitable donor age, made up of cohorts with higher earning capacity and purchasing power, should contribute to a better funded and more sustainable nonprofit and charitable sector in the long run.
The nonprofit sector has, for some time, been aware of these concerning national and provincial trends analyzed in this piece, but there are grounds for optimism. In a 2018 report, the increase in online donations among the young and “more educated Canadians and those with higher incomes” over the last 15 years has been a boon for the sector.
![]() Over the coming years, the nonprofit and charity sector will have to rely more heavily on leveraging new technologies for fundraising and finding other creative solutions to address some of the worrying trends cited in this report. Sector-led responses alone may not be enough. A public policy intervention may be necessary, such as: developing more creative and generous tax breaks for donors, alongside a public awareness campaign to promote it.
Over the coming years, the nonprofit and charity sector will have to rely more heavily on leveraging new technologies for fundraising and finding other creative solutions to address some of the worrying trends cited in this report. Sector-led responses alone may not be enough. A public policy intervention may be necessary, such as: developing more creative and generous tax breaks for donors, alongside a public awareness campaign to promote it.
For the academically minded a version of this report with all the source notes in place is available on the CDH web site. www.cdhalton.ca
Community Lens is prepared by Community Development Halton to disseminate and interpret important community data as it becomes available. For more information please contact us at data@cdhalton.ca or 905-632-1975
Community Development Halton would like to acknowledge the ongoing financial support of the Regional Municipality of Halton.


Donations down, I am shocked