


 By Staff
July 12th, 2021
BURLINGTON, ON
The widening income gap between the rich and the poor can impact negatively on economic growth, standard of living, health and well being, and social inclusion. High income inequality also raises a moral question about fairness and social justice.1 In Canada, the income gap between the top 1 percent and the median household has been historically large and is growing steadily larger.2
Custom tabulation from Statistics Canada’s taxfiler data file provides an opportunity to learn more about income inequality in Halton Region. Determining the share of total income by population deciles is one of many ways to measure income inequality. The population is divided into ten equal groups (10% each) from the poorest (lowest decile) to the richest (highest decile) – according to the distribution of values of a particular variable. Then the proportion of total income captured by each group is calculated. If each group has 10% of the total income, there is no income inequality.
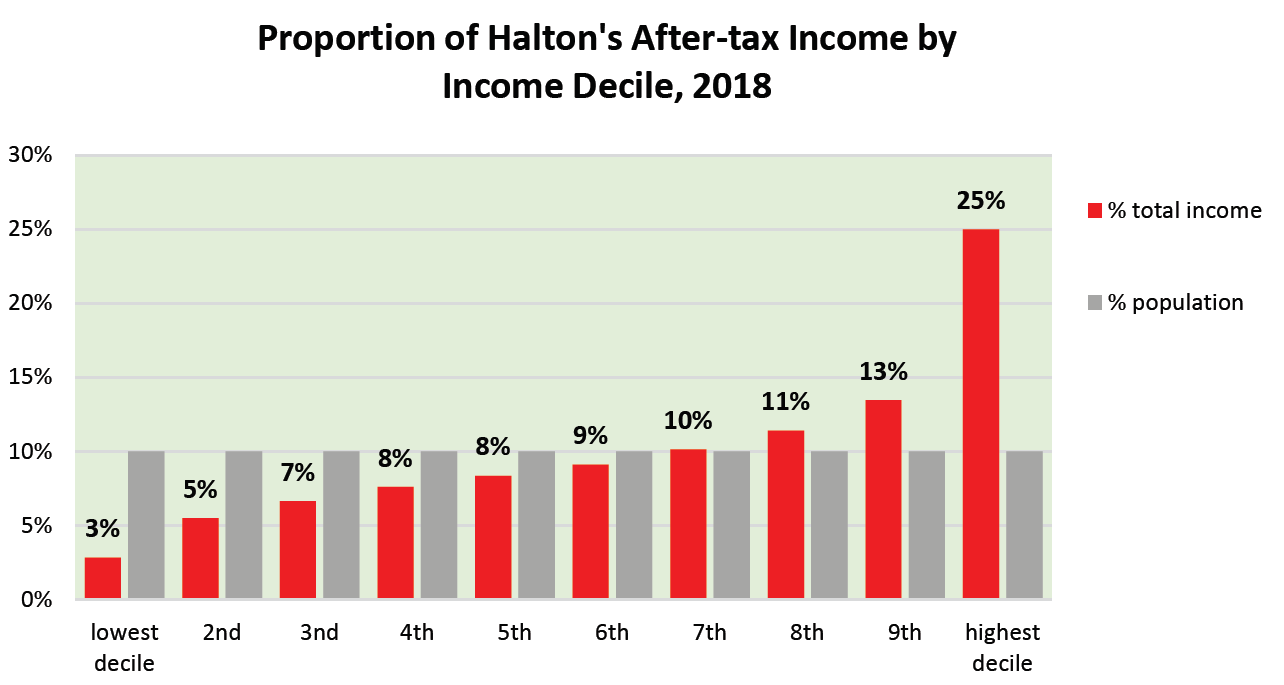 Using the most currently available data, in 2018 the highest decile (10%) of the population in Halton has by far the largest share (25%) of the total after-tax income (disposable income) and the bottom decile captures only 3%.
Oakville has a wider gap between the highest decile (28%) and the lowest decile (2.1%) than the other three local municipalities.
The concentration of income/wealth becomes more skewed when looking at income of the top 1 percent of the population.
The top 1% of Halton’s population (5,730 individuals) has 7% of the total disposable income. The top 1% of Oakville’s population (2,040 individuals) has 8.3% of the town’s total disposable income.
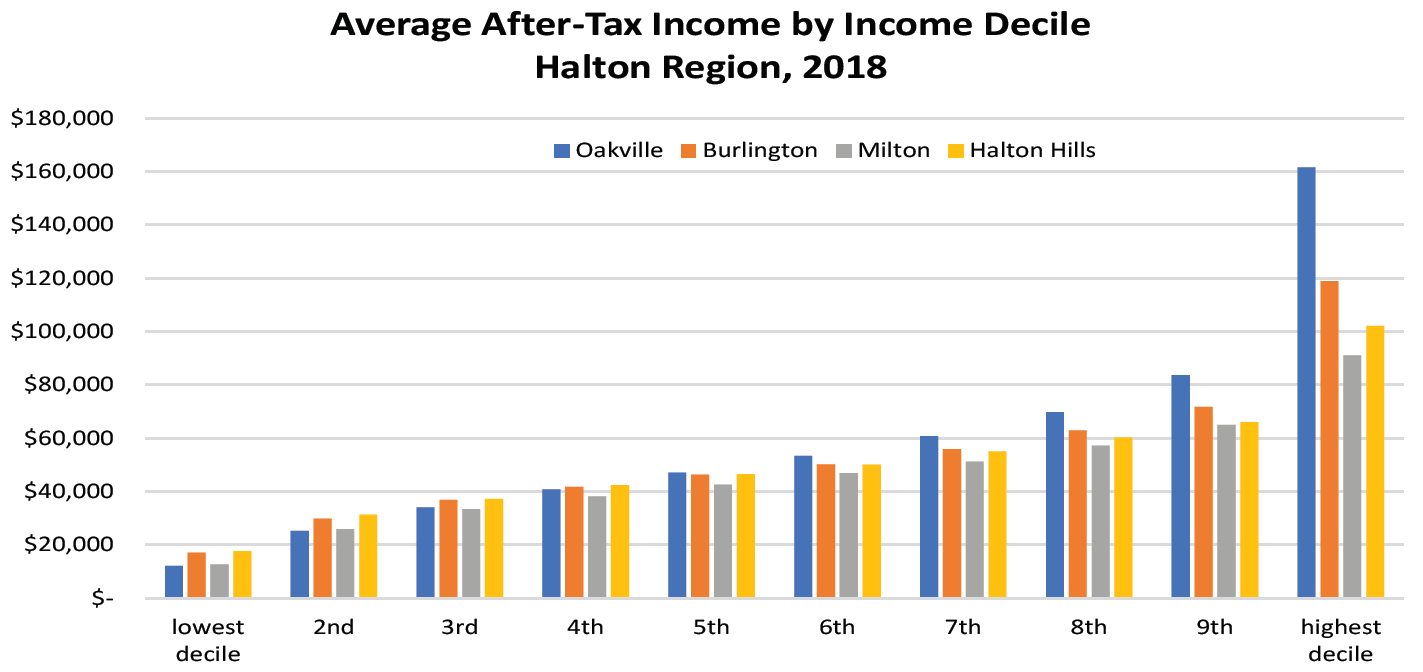
Another measure of income disparity is to compare income levels of various income groups. The population is sorted according to their average disposable income and then divided into 10 equal groups (deciles) each containing 10% of the population.
In Halton, the average disposable income for the top decile (top 10% of the population) was 9 times higher than the bottom decile (bottom 10% of the population). In other words, on average, for every after-tax dollar earned by individuals in the top decile, those at the bottom decile earned 11.2 cents. In Oakville, the difference is 13 times. The individuals in the bottom decile earned only 7.5 cents. In fact, the bottom decile in Oakville has the lowest average after-tax income among the local municipalities.
 The impact of Covid-19 on the income gap among Canadians has been pronounced.
According to a CIBC Economics report,3 Covid-19 has resulted in a dramatic widening of the income gap.
The data shows that this has been fuelled not only by the expected loss of many low-wage jobs, but also by an unexpected increase in the number of high-wage jobs in the fourth quartile of the wage scale, which had year-over-year growth of more than 9% or 260,000 jobs.
In fact, the report goes on to say “…if it were not for the increase in high-wage jobs during the recession, the overall level of employment today would have been almost one million below the pre-recession level.”
As we come out of the pandemic, how we respond to those that have been most impacted is critical to recovery.
If you have any feedback/suggestions on the issue of income inequality in Halton, you can contact us at data@ cdhalton.ca.
Community Development Halton would like to acknowledge the ongoing financial support of the Regional Municipality of Halton.


“Income Inequality in Halton – disturbing differences”
What’s disturbing is that this doesn’t break the groupings down by age.
In western society we expect some one who has worked for 40 years to make much more that a worker starting out.
What do you expect. Burlington and Oakville used to be anl probably still are the executive bedrooms for Toronto and Hamilton, thus the disparity as described in the data