BURLINGTON, ON. April 22, 2013. Five very smart people gathered in the Community WHAT at the Burlington Performing Art Centre last week to talk about the city’s Community Energy Plan. They met in a Workshop setting – and while energy is vital – it isn’t the most exciting thing to sit in a dark room and look at power point presentations for a couple of hours.
That time proved to be very well, actually exceptionally well spent.
We learned how the city has mapped the way energy in the city is used. We learned how critical energy use is to attracting new business to the city. We learned how stakeholders in the city look at the way energy is used. We learned what and how Burlington Hydro can be a leader in the creation of a more energy-efficient city.
How do we heat our homes? How do we heat our office buildings? Remember when Hydro had programs for us on how to convert to electricity? They would pay you to tear out those radiators and put in electric baseboard heaters and more insulation in the attic. Turned out that wasn’t such a good idea and now Burlington has more than 4500 homes heated electrically and we are looking for ways to convert those homes to something more economical. Who knew?
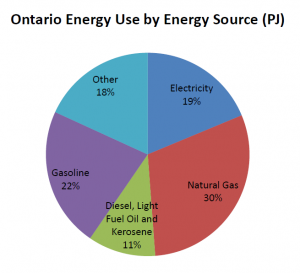
Natural gas is now the energy use of choice. There is now far more natural gas than we need – so much that we now liquefy the stuff and send it off to places that need the energy. The Americans have convinced themselves that they have so much natural gas that they will be energy sufficient soon and not need as much of that Saudi Arabian oil. That the Americans are fracturing to get much of that natural gas is another matter.

The graph on the left sets out the housing stock we have and when it was built. On the right the graph sets out the different square footage of the housing stock we have. A large house built at a time when energy was cheap is an expensive building to heat in today’s markets.
The kind of energy you use and the amount you use is determined in large measure by when your house was built and how many square feet of space you have.
Katelyn Margerm, a researcher with the Canadian Urban Institute, explained how she took data from multiple sources and mashed it all together to tell the story of how people in Burlington use energy.
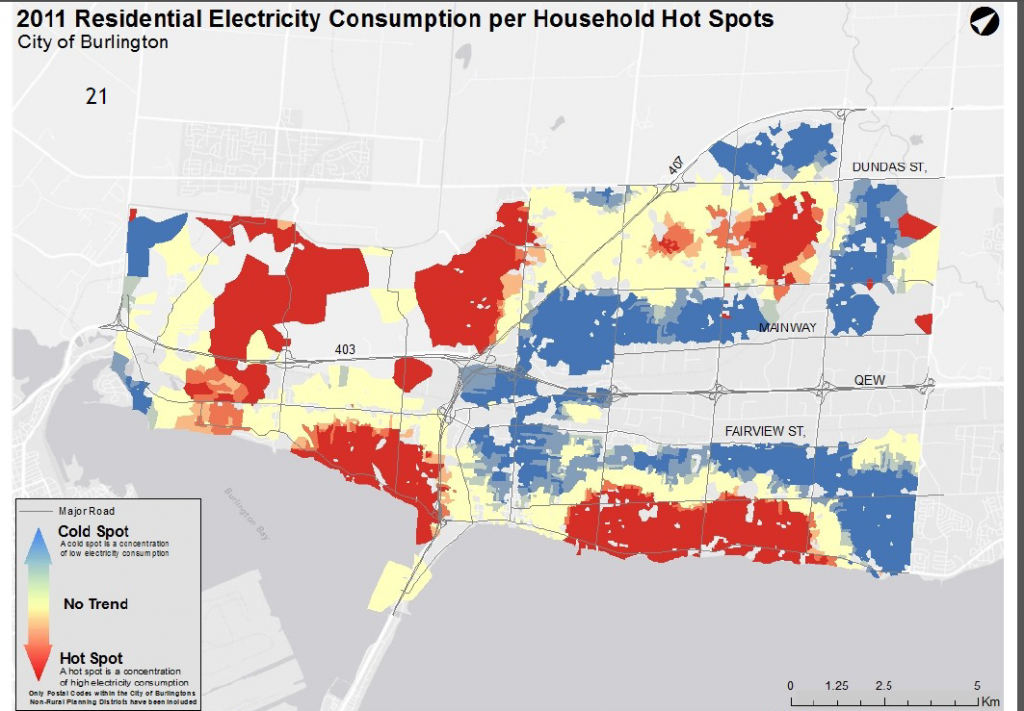
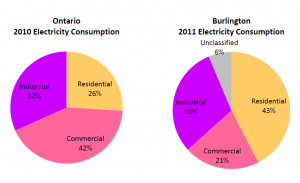
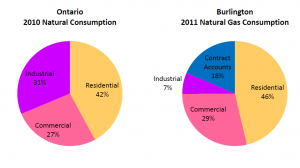
Spend some time comparing the electricity consumption map with the gas consumption map. where do you fit in this picture?
Spend a few minutes looking at the data she collected. Where do you fit into the pattern of energy use? What are the options for you? Are the options you have similar to the options the city has? Are the city’s options important to you?
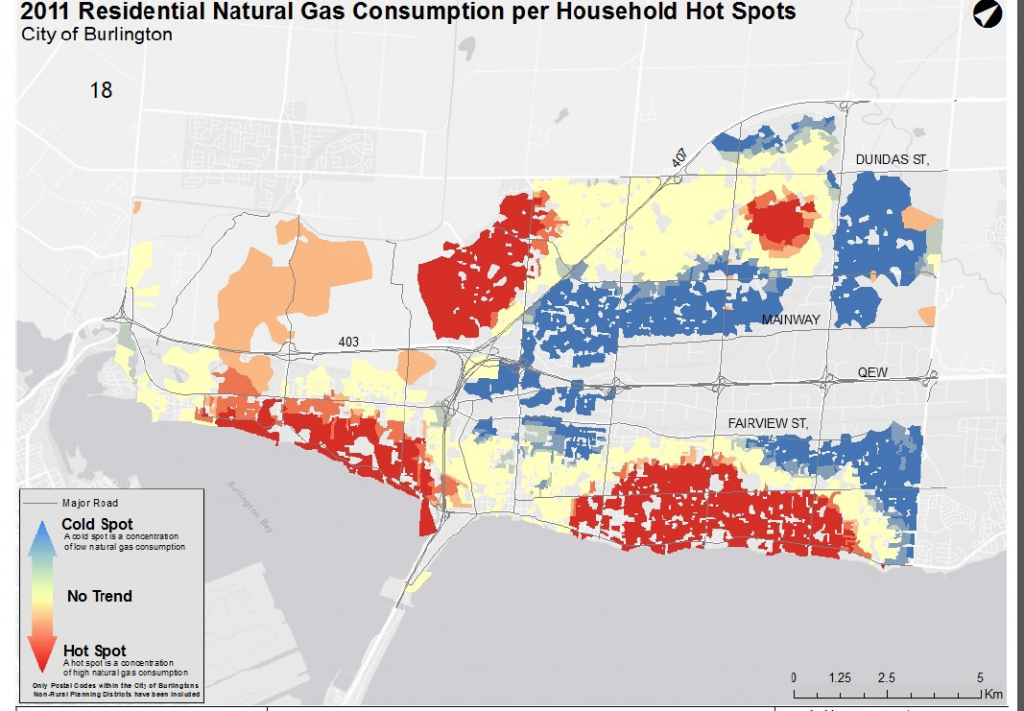
Natural gas consumption is significantly different than the consumption of electricity. Given that the supply of natural gas is very high right now and will remain that way for at least ten more years one would think this is the route to go. Is it?
More questions than answers at this point – but the answers Burlington comes up with are critical to how financially healthy this city is – and if it isn’t financially healthy – guess who is going to pick up the shortfall?

Nearly half of housing units in Burlington were built before 1980. More than half of units are between 1,500 and 2,500 sf
This work helps form a baseline which can be used to establish community energy targets and timelines. Industrial, commercial and institutional location mapping allows planners and economic development people to explore future development scenarios and to help identify opportunities for conservation and retrofit and think through land use policy (infill, zoning).
One of the next step is to overlay the information now in hand with demographic information and consumer attitudes using the Environics Analytic s information to design retrofit and conservation programs.
If you didn’t think energy efficiency is all that important – stay with us as we take you through a series of articles on what we learned last Thursday afternoon.
Part 1 of a series


