


 By Pepper Parr
August 20, 2015
BURLINGTON, ON
Part one of a two part feature on how the Conservation Authority explains The Flood.
All most people have are memories of the flood we had more than a year ago. Any claims that were made for financial support under the Ontario Disaster Relief Assistance Program (ODRAP) have been paid – although no one has yet been able to say just why the provincial government held back 10% of the money it put up for what they called “risk mitigation”.
MPP Eleanor McMahon has made it a practice to continue to call on some of the people who were badly flooded to see how they are doing. The province has announced major changes to ODRAP that will be ready sometime in 2016.
The only thing ahead is the celebration of the $5,000 + donours and the placing of a plaque, that will take place September 15th at the Performing Arts Centre where a documentary done by Cogeco will be screened.
Reports on what actually happened have been prepared and while they are public – they haven’t been given all that much attention. Those reports have costs buried in them – the flood is going to cost taxpayers millions.
City hall seems to have forgotten that there is a public out there that does want to be informed.
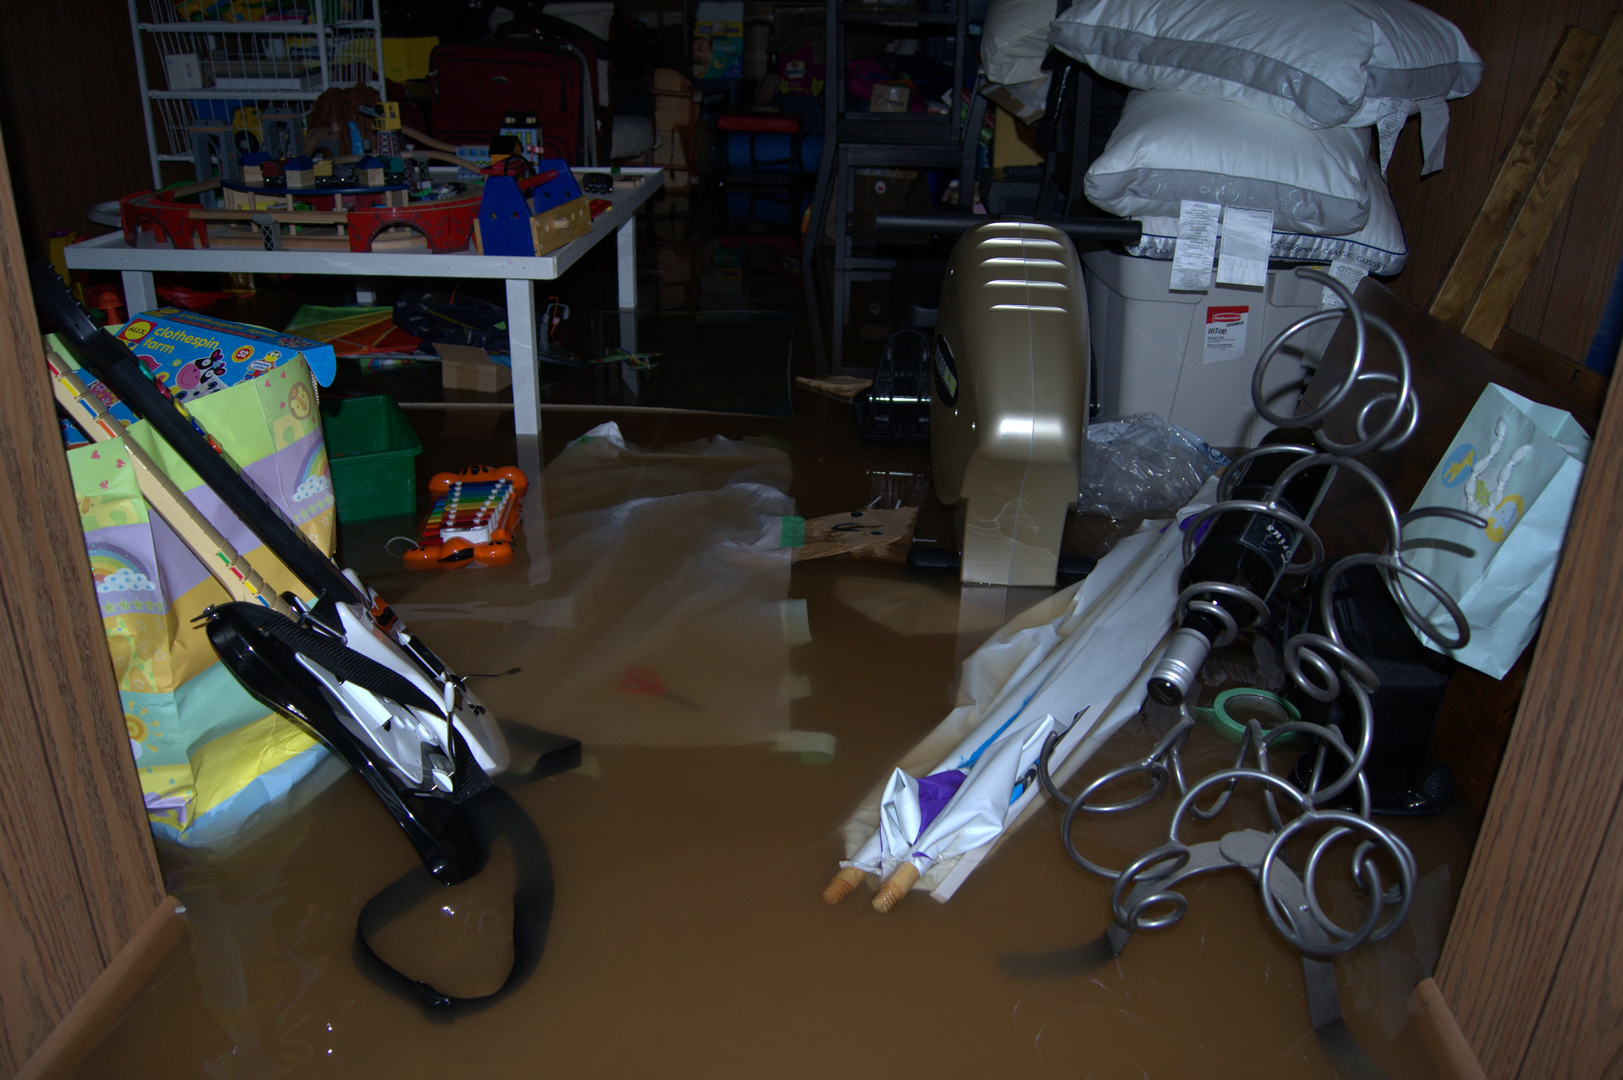
The rain clouds settled over Tuck Creek and remained there for seven and a half hours flooding the basements of more than 3500 homes in the eastern side of the city.
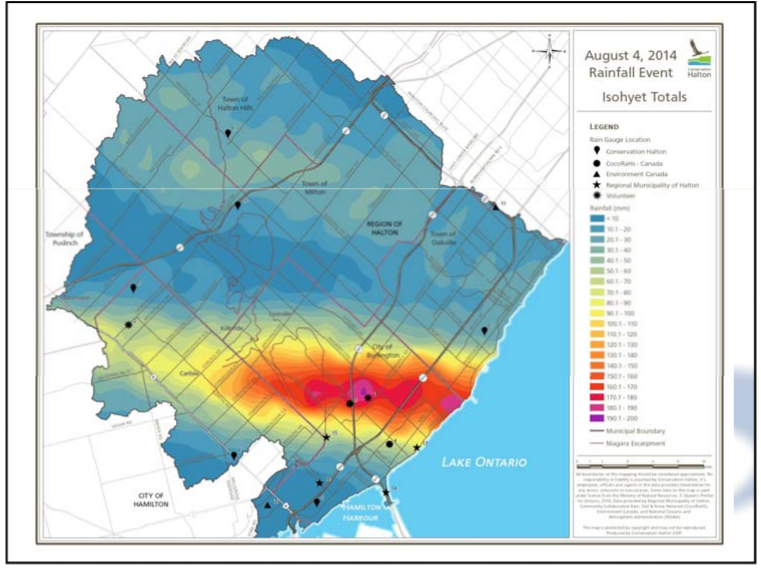
The centre of the August 4th, storm occurred just downstream of Highway 407 along Tuck Creek. The rainfall that occurred at the storm centre was approximately 190 mm, and is similar in total to the Regional Storm. That Regional storm is a benchmark used for comparative purposes – the public knows it as Hurricane Hazel which took place in 1954
The Halton Conservation Authority released its report in which they set out what happened based on the data that was available; they also provided a number of recommendations.
The Conservation Authority is responsible for what they call the riverines and how the water moves through them.
Their report sets out the bigger picture and some of the reasons why the flood did the damage it did –– they make it very clear that global warming is something very real and something we have to accept as part of how we plan for adverse weather.
Heavy rain fell on Burlington during the afternoon and evening of August 4th, 2014. The storm extended from roughly Mountsberg Road in the north to Lake Ontario in the south, Burloak Drive in the east, and Brant Street in the west. A band of thunderstorms continued to develop and intensify during the day over the area.
The eastern part of Burlington was about to be engulfed by a storm that would cause havoc, significant financial loss and change for decades the lives of some families.
The part of the city that was deluged with rain came from a storm aligned in a northwest to southeast direction. The area was elliptically shaped with a length of approximately 25 km and a width of approximately 9 km. The area of the storm was approximately 200 square km.
The storm was centred over the middle and upper portions of Roseland Creek, and Tuck Creek just east of Highway 407.
Its intensity is seen in the videos taken that day. Dundas looking north on Guelph Line, and Palmer Drive.
The watercourses most impacted were Tuck Creek, Shoreacres Creek, and Appleby Creek.
An additional feature of the storm was that it hovered in place from about 1:30 pm through till just before 9:00 pm. There were actually three storms separated by short periods of time; never more than 45 minutes. The significant runoff in a short period of time, basically a flash flood, hit homes, businesses and parks. The flow of water overtopped watercourse crossings, closed roads, and flooded motor vehicles.
Homes were flooded by runoff that entered the buildings through the sanitary/storm sewer system, and from runoff that overflowed watercourse banks.
Incorrectly installed downspouts added to the problem.
Reports were released by both Conservation Halton and the city of Burlington. The Conservation report deals solely with runoff that overflowed watercourse banks (riverine flooding).
The Region of Halton and the City of Burlington have the task of assessing flood damages from storm and sanitary sewer systems which they did through separate studies.
It is the city report that sets out the extent of the damage to property and homes and sets out where changes need to be made – including the need to remove some homes that are now at risk.
An additional financial result for the people of Burlington is going to be a Storm Water Management tax that is going to hit the malls with those large parking lots quite heavily. Think in terms of at least a 4% tax increase each year for perhaps two years.
More than a handful of weather elements combined to create a very small in area storm that flooded thousands of basements.
Approximately 6000 properties were flooded within the City; roughly 3500 of which reported basement flooding.
On August 4, 2014 the atmosphere over south central Ontario in the afternoon was very moist and unsettled making it favourable for storm development.
People were out and about enjoying the holiday. Joseph Brant day was being celebrated at LaSalle Park, which turned out to be well outside the part of the city that got drenched. There were strong winds but not much more than that.
The winds aloft were generally light and from the west, meaning that if storms were to form, they would drift slowly from west to east allowing notable amounts of rain to fall on the areas they passed over. The general light wind pattern also made it a day where a lake breeze circulation could set up and, by early afternoon, the surface winds began to blow inland from Lake Ontario. As the afternoon progressed, these factors came together to generate shower and thunderstorm activity. The lake breeze circulation combined with outflow winds from other nearby storms resulted in a series of storms over the Burlington area.
There was a repeated development of storm cells to the west of Burlington which the weak winds aloft caused to drift continually over the eastern part of the city. When the storm arrived it just hung in the one rather narrow area and didn’t move.
The Conservation Authority measures storm activity using data from approximately 34 rainfall gauges and two radar stations.
The gauges are owned and operated by various agencies.
The Region of Halton had 11 gauges
Conservation Halton had 7 gauges
Burlington had 1 gauge at the Mainway arena
There were only three gauges close to the storm centre. Due to the narrow width of the storm cell, most of the rainfall gauges within the Burlington area didn’t catch any of the rainfall.
Radar data was used to refine the rainfall distribution across Burlington. NexRAD radar data was obtained for the Buffalo station through the National Oceanic and Atmospheric Administration (NOAA). Radar data was also obtained from the King City (Environment Canada) station.
A storm that did very significant damage to property on the eastern side of the city was so small in area that it slipped through the gauges that were in place to record and report on the rainfall. The only people who were aware of the storm and its intensity were the people in the middle of it.
Water began to accumulate along the side of the escarpment and worked its way into the creeks and came cascading into the city using creeks that could not handle the volume which meant water was pushed over the creek banks, flooding into streets and lawns that could not absorb all the water in such a short period of time.
This video was taken at Eaglesfield Drive south of Dundas . This footage taken at UpperMiddle Road – Headon – Centennial is almost entertaining; they both show just how much water there was on the streets.
Rain from the roofs of housing poured through downspouts – with thousands of them draining into the waste water system that was not built to handle that kind of volume.
The rainfall that started at approximately 1:30 pm and ended by 9:00 pm was measured at approximately 196 mm – it all came down in a seven and a half hour time frame.
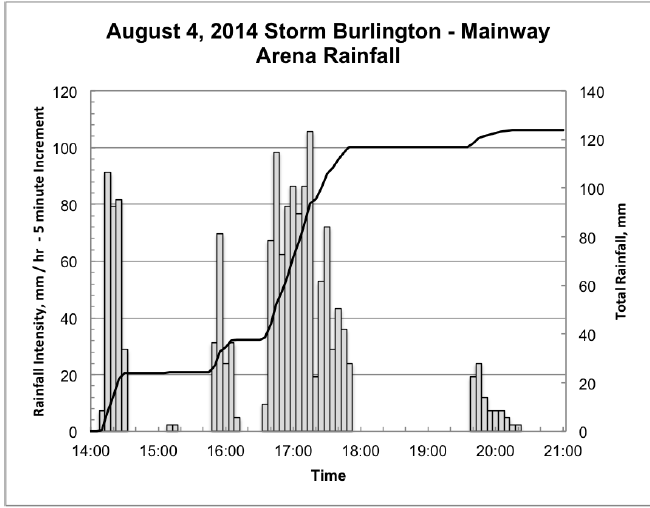
The bars show the time that the three main storms hovered over the city and their intensity. The line is the measurement of the rain that fell in the Mainway arena tipping bucket.
The data collected revealed that there were in fact three separate storms – all three hovered over the same areas and each had its own intensity.
It was the accumulation of the three storms that the creeks and the water run off could not handle.
The closest rain gauge to the centre of the storm that recorded the distribution of rainfall was located at the Mainway Arena. The maximum rainfall recorded at the Mainway gauge was approximately 124 mm.
The device at Mainway was a “tipping bucket” design – something that when it is full tips over and empties. “The rain was coming down so heavily that the bucket filled very quickly and would tip over and empty – making it difficult to get really solid data.
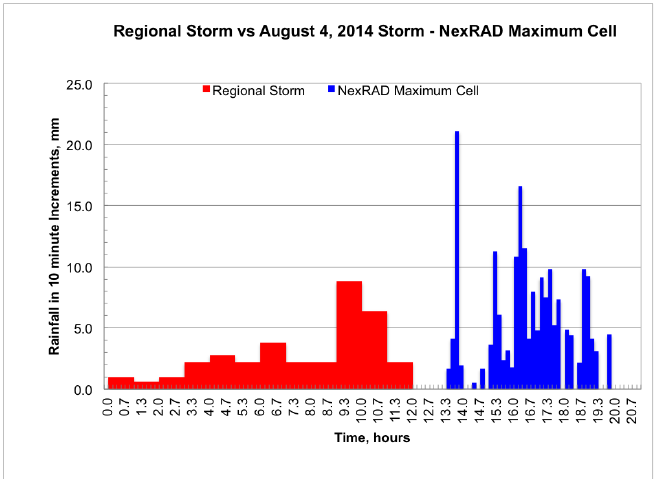
This chart compares the rainfall during hurricane Hazel with the August 2014 storm that Burlington experienced.
Conservation has a benchmark they call a Regional storm (Hurricane Hazel which hit Etobicoke in 1954) that is used for comparative purposes.
Average rainfall for each watershed was:
Roseland Creek 120mm
Tuck Creek 150 mm
Shoreacres Creek 140 mm
Appleby Creek 130 mm
Sheldon Creek 100 mm
That rainfall tore through the creeks which is some cases had a lot of vegetation and tree limbs that should have been cleared out regularly.
The Insurance Bureau of Canada (IBC) reported that the preliminary estimate for insured damage caused by heavy rains and flooding in Burlington was just over $90 million.
Insurance did not cover the cost of all damages. Some owners received full coverage while others were only partially covered or not covered at all. Approximately 6,000 properties were reported to have experienced flooding, some caused by overland flow roughly 3,500 from basement flooding (storm water or sanitary sewer backup).
The Conservation Authority was focused on damages as a result of floodwaters overtopping the banks of watercourses. Specifically, the Conservation observed and/or reported riverine (creek-based) flood damages for each watercourse. This list does not include flooding associated with storm water (from roadways, ditches, etc.) or sanitary sewer backup as these flood impacts are being assessed by others.
Roseland Creek: Two (2) commercial buildings flooded; approximately two watercourse crossings overtopped; QEW closed; and Watercourse scour and erosion.
Tuck Creek: Approximately 65 residences flooded; One commercial building flooded; approximately 13 watercourse crossings overtopped; Highway 407 ETR closed;
Natural gas main broken upstream of Upper Middle Road; Sidewalk collapse on south side of New Street;
Rural ditch erosion repairs; driveway culvert repairs/replacements at washout locations; landscaping damages – parks, high schools; and Watercourse scour and erosion.
The data available places the centre of the storm downstream of Highway 407 along Tuck Creek. The rainfall that occurred at the storm centre was approximately 190 mm, and is similar in total to the Regional Storm.
Estimated flow rates upstream of Upper Middle Road are slightly greater than the Regional Storm while flow rates downstream are roughly equal to the 100 year simulated event. Flow rates decreased substantially downstream of Upper Middle Road. This is likely due to the availability of flood storage within the wider and more defined natural valley features along the upper portions of Tuck Creek.
Shoreacres Creek: Approximately 2 residences flooded; One industrial building flooded; approximately 5 watercourse crossings overtopped; Rural ditch erosion repairs; driveway culvert repairs/replacements at washout locations; QEW closed; pumping Station flooded; underpass flooded; and Watercourse scour and erosion.
The flow rates within the Shoreacres Creek watershed were estimated to range between a 50 year design event and the Regional Storm (Hurricane Hazel). There is a good possibility that runoff was diverted (spilled) into Tuck Creek from Shoreacres Creek along the north side of Highway 407.
Estimated flow rates increase in a downstream direction and are approximately equal to or slightly above simulated 100 year values for the lower two thirds of the watershed.
Appleby Creek: Approximately 3 watercourse crossings overtopped; Underpass flooded; trails and pedestrian crossings flooded; and Watercourse scour and erosion.
On the west tributary of Appleby Creek, estimated flow rates are approximately equal to the Regional Storm values. On the east tributary estimated flow rates are approximately equal to the 10 year storm simulated flow rates. Estimated flow rates downstream of the QEW are roughly equal to the 50 year storm simulated flow rates.
Several debris jams were identified during field investigations after the storm. These occurred in the following locations:
Section of Tuck Creek between New Street and Regal Road
Private bridge upstream of Shoreacres Road along Shoreacres Creek
Section of Shoreacres Creek downstream of Heritage Road
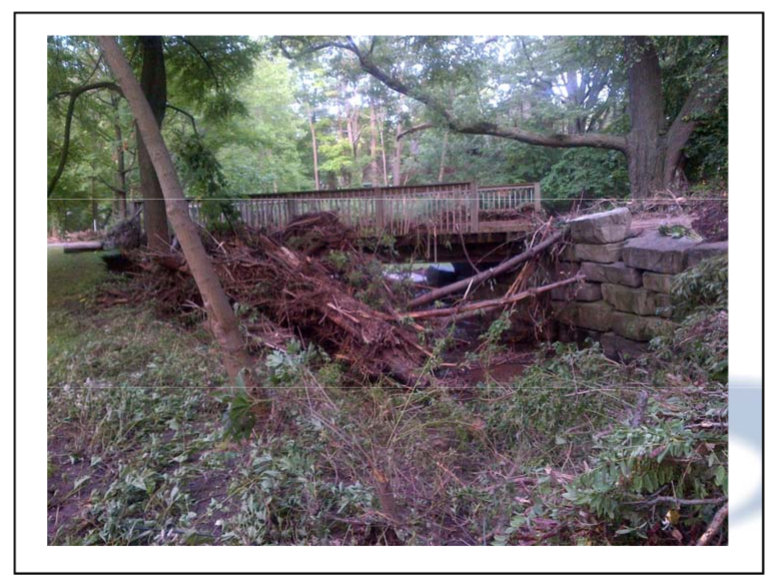
As the water roared through the creeks it pushed everything in front of it – including vegetation and tree limbs which did much of the damage to pedestrian bridges.
While the debris jams were not the cause of flooding in these highlighted areas (given the significant flows within creek systems during the storm), their impacts may have contributed to localised flood levels on adjacent properties.
Given the unprecedented nature of the storm event and the significant flows generated, a substantial amount of woody debris and creek substrate was mobilized during the storm. This was particularly pronounced in the older portions of Burlington in which the creek widths were narrowed by historic development and flood plain/overbank areas were not readily accessible to flood flows.
This configuration caused flood depths in the creeks to be higher and erosive forces to be more damaging.
Part two of a two part feature on how the Conservation Authority explains The Flood