


 By Jeremy Skinner
December 21, 2017
BURLINGTON, ON
This article is designed to stimulate the conversation as to why the residents of Burlington need to accommodate intensification, otherwise known as to Grow Up.
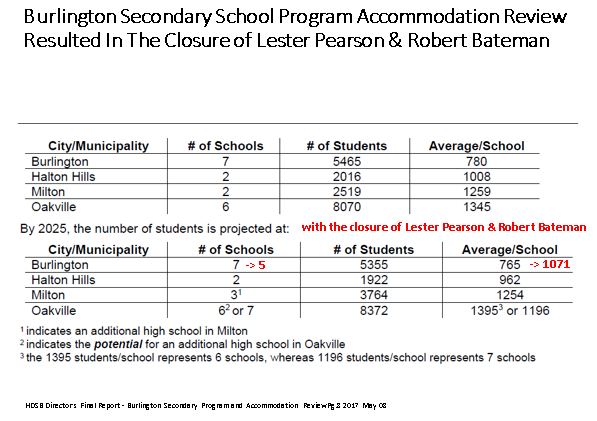
The recent Halton District School Board Burlington Secondary School Program Accommodation Review confirmed once again that we in Burlington have a serious demographic problem. By 2020 there will be approximately 1,554 (1,179 located south of the QEW and 376 located north of QEW) available student spaces across Burlington’s seven high schools. Because of the declining student enrolments, some students in Burlington’s seven secondary schools would not be provided the same equity of opportunity as other students within the Halton District School Board, and even fellow students enrolled in larger Burlington secondary schools. The reasons for Secondary School over-capacity relative to student enrollments are fivefold:
1. The rapid development of Burlington South of QEW suburbs in the 1960s and 1970s and North of QEW in the 1980s and thereafter.
2. The Provincial decision to create the Separate School Board alternative;
3. The more recent Provincial decision elimination of grade 13;
4. Empty nesters prefer to live out their retirement years in the family home; and
5. Families with children are no longer able to afford the cost of a home in Burlington.
I digress for a moment to counter any arguments as to the large turnover of residential real estate this past year will make a significant difference in emerging student enrollments.
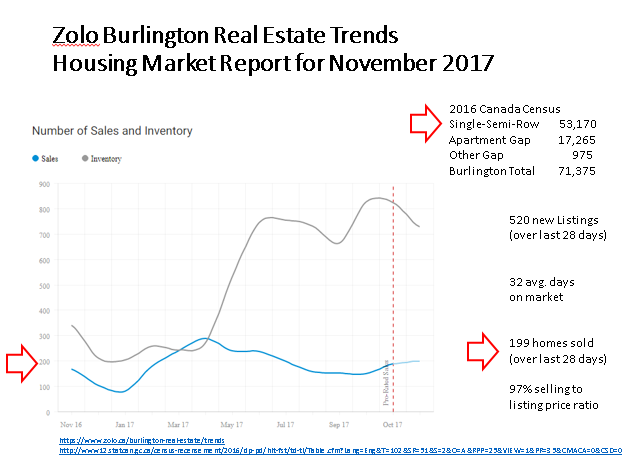
Zolo research into Burlington real estate transactions reveals an average house turnover rate of 199 houses per month with a peak of 238 houses last April out of a potential market of 53,170 dwellings comprised of detached, row and semi-detached houses based upon 2016 Canada Census Data. Please note that Zolo does not track transaction data associated with apartments or condominium units. Apartments represents 24% or 17,265 dwellings according to Canada Census data. Note that while there is currently a surplus inventory of approximately 500 houses looking for a buyer, the selling to asking price ratio remains high at 97%. These houses are simply taking longer to sell.
This data indicates that we must not expect a watershed moment when considerable number dwellings will transfer hands between legacy old and new families, including those with children, and instead focus our efforts to build family with children friendly new dwellings.
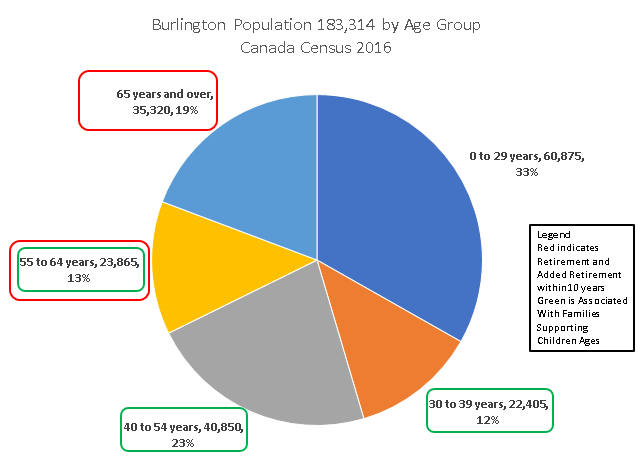
The mayor has been quoted that “almost one-third of the city’s population is 55 years of age or over”.
See the red boxed age groups. 19.3 per cent of the city’s population is 65 or older and approximately 13 per cent is between the ages of 55 and 64.
It is my opinion, that almost one-half of the city’s population are in the child supporting ages of between 30 and 65 years of age.
See the green boxed age groups. 12 percent of the city’s population is between the ages of 30 and 39, 23% percent of the city’s population is between the ages 40-54, and 13 percent of the city’s population is between 55 and 64. The challenges we face in the near future is how to accommodate those in their retirement years and those who are entering the labour force.
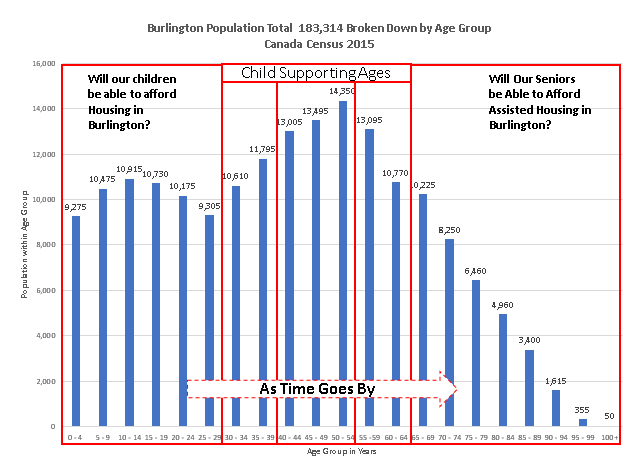
Permit me to depict this same information using a different chart style so that we may contemplate the future as more households move into retirement. We simply move the graphic to the right to visaulise how the population ages. The peak demographic group of 14,350 people currently aged 60 to 54 will enter retirement in just over ten years. We also need to contemplate what will happen to those currently less than 30 years of age. It is doubtful that most will be able to afford a non-apartment style dwelling assuming that one becomes available.
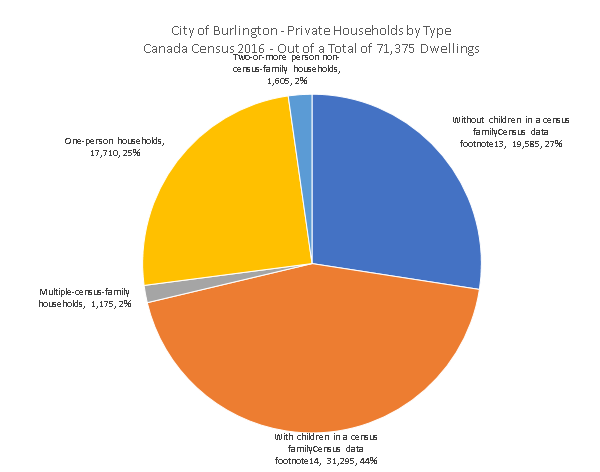
Chart 5 outlines the distribution of singles, couples without children, couples with children and other groupings residing in Burlington’s 71,375 dwellings at time of Census.
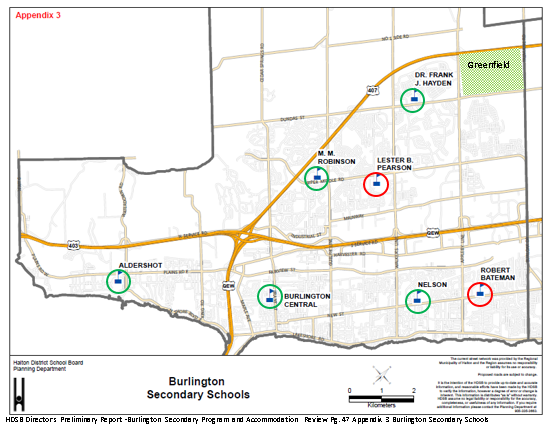
With only one greenfield left for residential neighbourhood development located in the North-East corner Appleby Line/Dundas St. in Burlington, the decision was made to close and Lester B. Pearson Secondary School in end of June 2018 and Robert Bateman Secondary School end of June 2019. By attempting to balance student populations across five schools, each student would be provided the same equity of opportunity as other students within the Halton District School Board, and even fellow students enrolled in larger Burlington secondary schools such as Nelson, M.M. Robinson and Dr. Frank Hayden.
Student enrollments at Aldershot Secondary School and Burlington Central High School will be monitored. Note that Aldershot Secondary School currently includes a contingent of Grade Seven and Grade Eight students in the same building. This implies that it is imperative that we provision more accommodations for families with children in the Aldershot area or be prepared to lose the school in ten years time.
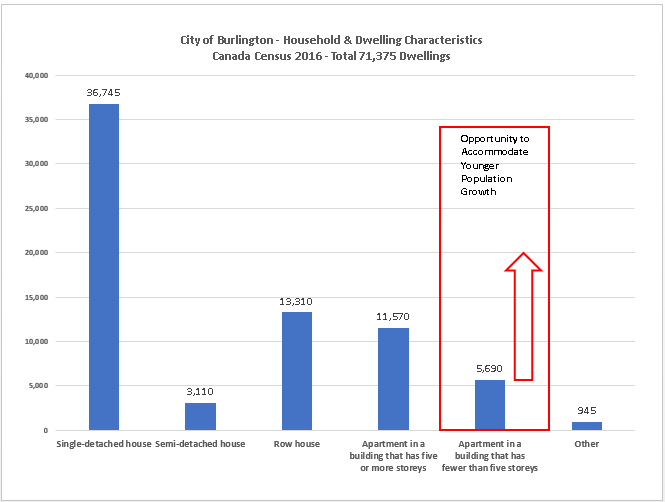
This leads us to the conclusion that families with children need to be attracted to Burlington into more cost-efficient accommodations, especially in those areas located below the QEW where underutilised community assets including parks, playgrounds, sports arenas, libraries and schools are located.
Let us spend a moment and contemplate the potential demographic effects on Burlington’s retail market.
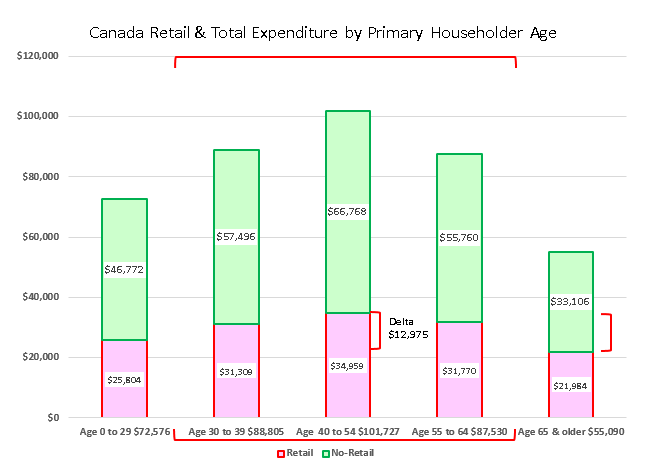
Canada Census has a model which illustrates the total expenditures by average Canadian primary householder. Note that the total and more importantly retail specific peak for the age groups of between 30 and 65 are normally related to families supporting children. The delta between peak $34,959 associated with ages between 40 and 54 and a floor of $21,984 associated with 65 and over represents a decline in retail expenditures of $12,795 or about 1/3. In other words, the more we age, the less we consuming from a retail perspective.
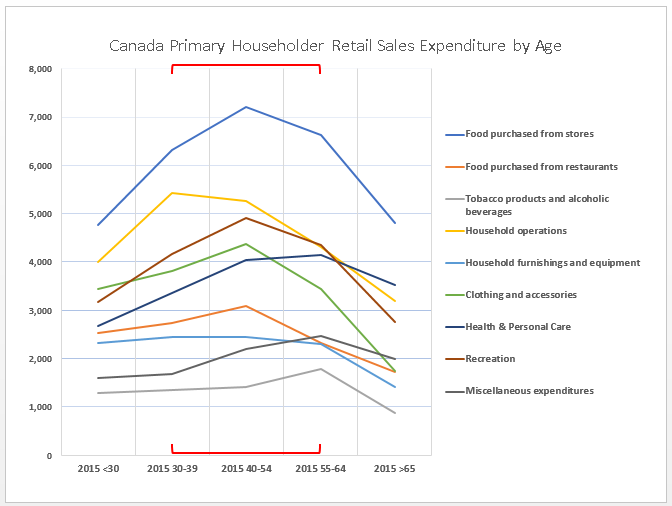
Taking this a step further identifies expenditures by retail category by primary householder age group. This chart may be useful in determining which categories of retail establishments are disproportionally impacted due to an aging demographic.
From top to bottom:
• Blue line indicates Foods purchased from stores;
• Light Orange line indicates Household Operations (includes household repairs, furnace/hot water purchases/rentals, cleaning & storage supplies, garden products & care, pet products & care);
• Brown line indicates Recreation (includes toys, video games, sports equipment and facility costs web-shopping target);
• Green line indicates Clothing, shoes and accessories (web-shopping target)
• Navy Blue line indicates Health & Personal Care (including pharmaceuticals, cosmetics, hair care, medical doctor, dentist, massage, etc.)
• Dark Orange line indicates Food and alcohol beverages purchased from restaurants
• Light Blue line indicates Household furnishings & equipment (appliances web-shopping target)
• Dark Grey line indicates Miscellaneous
• Light Grey line indicates Tobacco products and alcohol beverages (not purchased in restaurants)
The emergence of retail desserts indicates that the surrounding shopping population can’t support the retail establishment or can’t access the retail establishment, or the establishment real estate lease costs prohibitive in the area.
Let us consider where these retail establishments are currently located.
Areas depicted in orange represent retail corridors such as along Plains Rd and Fairview Avenue and the approximately fifty shopping plazas which typically are located at the intersections of major streets. Each has been identified for intensification and thus are mixed use sites. The challenge with many of these intensification nodes are that they will need to be rebuilt to accommodate residential units above and to provision parking for cars below. These rebuilt buildings will need to be carefully designed if reasonable transitions to bordering residential neighbourhoods are to be maintained. These sites will likely have a taller building component in the centre of the site or closer to the intersection and may be optionally surrounded by townhomes along some of the edges. Note the provisioning of underground parking changes the retail dynamic of the convenience shopper and those concerned about safety and accessibility.
The areas depicted in red relate to the existing downtown and uptown urban centres (located at Appleby Line & Upper-Middle Rd.). The proposed 3 Mobility Hubs are to accommodate future retail and residential opportunities housed within mid-rise mid-height and tall tower buildings surrounding the existing Appleby, Burlington and Aldershot GO transit stations.
Looking to the future, I have found two Canadian market sources which attempt to outline the future retail trends.
CBRE Real Estate Market Outlook – Retail Key Trends
• emphasize location and smaller, more efficient footprints,
• creating experiences that cannot be replicated online,
• seamless integration of the online and physical store network,
• logistics – upgrading systems and innovative fulfillment solutions
An illustration of Retail Real Estate Focus can be found at Main and Main which is a retail-centric, mixed-use developer.
Key site factors:
• Location – the hard corner, high visibility sites with maximum pedestrian traffic
• Growth – demographics and growth to drive retail sales.
• Lifestyle – neighbourhoods with the transit, arts and culture, and mixed-use vibrancy that consumers are looking for.
• Functional, inviting and efficient space for shoppers and tenants.
Conclusions
With no more land with which to expand the number of dwellings out over, we have no choice but to build up.
How well we manage this implied intensification will have a significant impact as to the quality of life amongst the residents of the City of Burlington.
Recent publications including City of Toronto’s Children in Vertical Communities Policies and Performance Guidelines may offer the Development Community and the City of Burlington with improved means to build more attractive condominiums for new families. I hope to review this document in a future article.
To do nothing, will likely imply higher taxes and fewer community and retail assets with which to access.
 Jeremy Skinner is a research who has worked with IBM and a major bank. The author cannot assume any liability as to the methods, associated data or conclusions which are depicted. They are simply provided for visualizing purposes only. This article expands on some of themes expressed by the author to City Council as part of the Statutory Meeting on the proposed New Official Plan.


Perhaps I need to read the follow-up piece – as it is written, the prescription “we have no choice but to build up.” does not logically follow from what I think you’re saying is the problem – the number of families with school age children is declining.
Let’s put aside the false claim made by our local politicians and planners that we have a problem with growth or intensification. Beyond being absurd, they are condescending, believing we just don’t get it and therefore need to be educated of our misinformed views.
The real problem is that our politicians and planners see intensification as the end – not the means to an end. They present an impoverished vision for our city which is about packing more people into more confined spaces.
We should aim for a higher aspiration, perhaps along what you’re championing – “let’s be the place where families choose to live in the GTA”. If that’s our goal, then we’d be developing different and better solutions: family oriented housing, decent urban green space and public amenities including in the mobility hubs; plus, true mixed use that supports desirable walkability.
Despite the planning rhetoric, that’s not what we’re getting.
Instead we get 23 storey structures that provide no guarantee of family units or affordability. We get back-to-back townhouse developments with no greenspace, lots of asphalt, and crappy balconies overlooking parking lots that are counted by planning as public amenity space.
Intensification should not be our highest aspiration; it should only be in service to something better.
Jeremy,
Lots of data again that will some time to consider, and how you interpret it. I see one slip-up though regarding your start with schools.
It appears that you are treading onto ground on this that you have not paid attention to over the last year. Natural demographic processes are not to blame for the schools crisis and conflict – it’s the Halton School Board that caused this.
So to fill the gap in your piece, with real data, here is something to add.
The fact is that the official data shows that the crisis we face was caused by deliberate and knowing actions by the Board to build the NE Burlington school (now named Hayden) capacity that was not needed based on enrollment trends and utilization expected.
The data prove that this is the planned and only cause of the current utilization issues in Burlington schools.
There was no business case in the normally applied manner based on sufficient need for pupil places in excess of seats available, and growing for the foreseeable future.
My first point is that Hayden was built with no seeming regard or public disclosure for the consequences that were built right into the plan from the start – surplus seats in the other Burlington high schools, and Hayden bursting at the seams.
Data show this was done by the Board in their planning, boundary and feeder changes, and construction.
For example, a Board Information report dated October 9, 2008, which is Appendix 1, in the HDSB FOI response to me, page marked 14, bullet 9, offers proof of plans then of student numbers to be moved to Hayden from the other schools at 1000, and 500 to be redirected from feeders.
The 1000 were accumulated in the 4.
I did not see anything in writing describing what the Board and Ministry had in mind about what a business case is, or what the thinking behind the business case was, as contained in the Capital Priorities Template sent to the Ministry in 2009. This seems to be the way business is done. Either there’s nothing in words, or it’s not available publicly.
In the 2009 plan, submitted to the Ministry, it showed Hayden overflowing with students within 3 years of opening, and continuing this trend. In planned consequences, back in 2009, MM Robinson utilization was planned to decline, by 2022, from 93.7% to 53.4%, and Bateman to decline from 99.2% to 43.9%, by 2018/19. Nelson declined from 108.7% to 95.6%.
To repeat, Bateman was targeted before 2009, and in the 2009 Priorities Template of the Ministry, its planned UTZ of 43.9% was actually colored in Red.
Most of these declines directly coincided with Hayden’s projected opening in 2010. By 2022, 1567 students were in these declines, many transferred to Hayden. This number coincides with the numbers cited above in 2008.
The more recent data, shown by the Board, at the November PAR public meeting, and titled in a slide as, “Current Situation: Low Utilization”, paints an even worse picture of what has been done by the Board and only made public in this PAR.
This data clearly shows Hayden continuously overfilled grossly with students transferred largely from the other schools, as part of the plan. And this is being facilitated with portables, as part of the plan too.
From no students on 2010, Hayden goes to 129% UTG in 2016, and projected at 159% in 2020 and 141% in 2025. At the same time, the other schools continue the planned decline, but now there are 4 schools that are in that situation, not just the 2 schools identified in the 2009 plan, as I noted above. This data is as follows;
– From 112% UTZ in 2010, Pearson declines to 61% in 2016, and projected to 55% in 2020, and 50% in 2025.
– From 87% UTZ in 2010, Robinson declines to 53% in 2016, and projected to 47% in 2020, and 46% in 2025.
– From 107% UTZ in 2010, Nelson declines to 75% in 2016, and projected to 83% in 2020, and 79% in 2025.
– From 95% UTZ in 2010, Bateman declines to 59% in 2016, and projected to 55% in 2020, and 50% in 2025.
Looking at the option 23e, in Miller, and the overall plan for Hayden from 2009, and you can see that according to that option outline, Robinson is also overfull by 2020, as Hayden is now to the end of the planning horizon.
Overall utilization in this option will be around 100%.
So why are we closing schools? Will Burlington never need another, ever?
Are future students to be bused or packed into portables?
This is the actual data showing how building Hayden created new seats that then became surplus seats for the rest of Burlington schools. We now have a situation of over-utilization and under-utilization, the main cause of which is building Hayden and then over-utilizing it using boundary, feeder, and program policies.
Great information, just one correction: Central High also includes grades 7 & 8, which is the reason many people have chosen the core as the neighbourhood in which to raise their children, i.e., walkability to schools.
I was referring to the map associated with Schedule B-1 entitled “Growth Framework” in the proposed New Official Plan found here.
https://www.burlington.ca/uploads/21466/Doc_636458223138380083.pdf
This is a great explanation of the demographics. However lots of areas are aging out and re-setting by themselves. Come to Aldershot where new kids show up at the bus stop all the time.
I’m not opposed to development efforts but, 800 square floor apartments sold for $500,000 are no good to the demographic you are attempting to attract. The current development direction is no good.
Greg has it exactly right about areas “aging out and resetting by themselves” (I’m seeing that in my neighbourhood) and that 800 sq. ft. apartments with too few elevators will not be helpful.