June 25th, 2024
BURLINGTON, ON
Every four years BMA Management Consulting Inc., prepares a financial condition assessment report for the city.
The BMA people prepare similar reports for many municipalities in the province which gives them a deep understanding on how well or poorly the municipalities are doing financially
The report is an analysis of the City’s current financial health and position, observations and review of the city’s existing financial policies and comparison to the last financial condition assessment, which was completed in 2019.
The intent of the BMA report is to provide a systematic process to monitor and evaluate a municipality’s financial outlook and performance using several recognized financial indicators, which are structured into the following three sections:
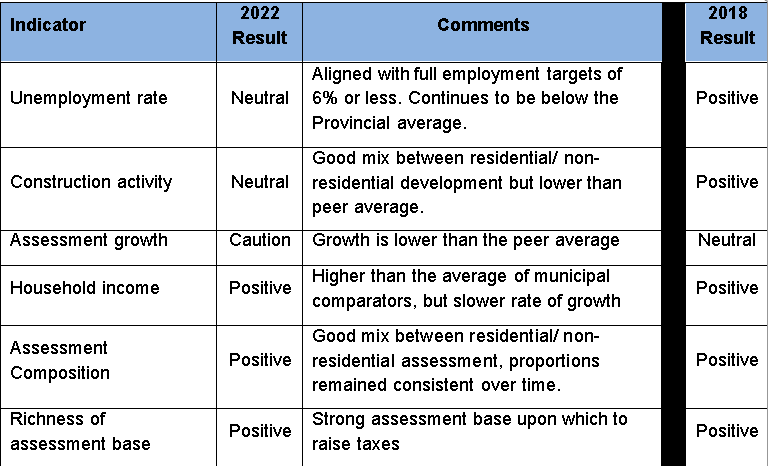
- Growth and Socio-Economic indicators
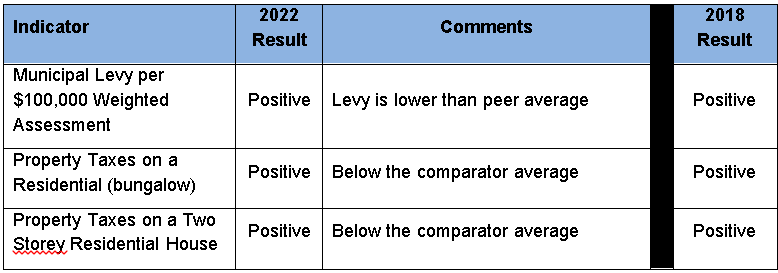
- Municipal Levy, Property Taxes and Affordability
- Financial Position
The analysis includes a comparison of Burlington’s results against recognized industry standards, provides historical trend information, as well as a comparison to seven peer municipalities, being Oakville, Milton, Markham, Whitby, Oshawa, Kitchener and St. Catharines. The same municipalities were also used in the previous study as comparators.
For each of the three sections, this report summarizes in a table the financial indicators for Burlington based on the consultants’ review. In addition, a comparison to the 2018 results is provided to denote changes/trends as follows:
- Positive: an alignment with the City’s goals, policies and industry standards. At or above the targeted performance indicator and/ or trending positively
- Neutral: a situation where the City is not yet fully aligned with the City’s goals, policies and industry standards. No target indicator and/ or stable trend.
- Caution: indicates that a trend has changed from a positive direction and is going in a direction that may have an adverse effect on the City’s financial condition and/ or trending negatively. This is also used to indicate that, although a trend may appear to be positive, it is not yet in conformance with the City’s goals, policies or industry standards.
Below are some highlights of BMA’s evaluation.

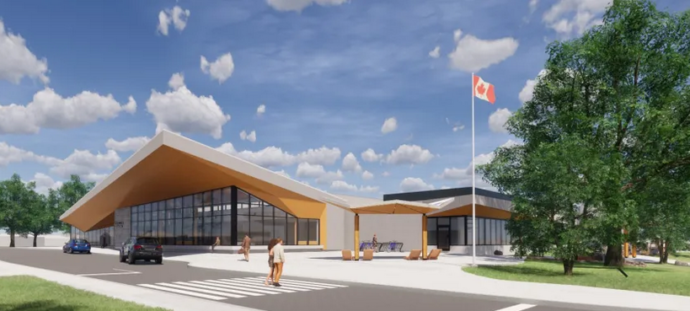
Major Civic Square design upgrade – paid for with a combination of grant money and funds in a reserve.
1. Growth and Socio-Economic Indicators – Summary
Growth and socio-economic indicators encompass various economic and demographic characteristics including population, employment, household income, assessment, construction and business activities.
Highlights
- From 2006 to 2022, average annual population growth in the city is 1%. Much of the new growth in the city will be through intensification, impacting future service delivery
- The city is in the midst of a demographic shift with a growing population of adults 65+, impacting the ratio of working-age people to seniors to 2.7 in 2021 which is lower than the provincial average (3.3). Resulting in fewer working taxpayers, and a greater proportion of residents on fixed incomes
- Commercial vacancy rate has increased substantially from 5% in 2019 to a high of 23.1% in 2022, driven by the increasing work from home trends
- Residential / non-residential construction activity is a 61/39 split (over the last five years), representing a good balance between these two types of development, signifying a well-diversified assessment base to support municipal programs
- The City’s weighted assessment per capita is the third highest in the survey, an indicator of the community’s ability to pay for services and support municipal programs
- Annual average net assessment growth in the city has declined sharply to 0.62% which may be an ongoing challenge
- Growth will continue in the city driven by intensification to facilitate the provincial housing pledge of 29,000 units by 2031
2. Municipal Levy, Property Taxes and Affordability – Summary
This section provides an overview of the cost of municipal services (property taxes) in the City and affordability compared to peer municipalities.
Highlights
- 69% of revenues were from property taxes in 2023, compared to 65% in 2018, reflecting a growing reliance on property taxes
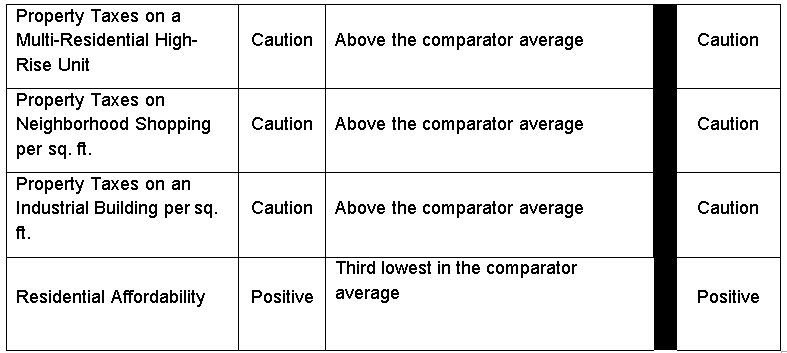
- The tax burden tends to be low for all property classes except for multi-residential, commercial shopping and industrial in comparison to the other municipalities in the comparator group, this is partially due higher tax ratios in Halton Region for these property classes.
- The levy per $100,000 of weighted assessment is less than the average of the municipal comparator group, reflecting a lower level of municipal spending in relation to the assessment base
- Property taxes as a percentage of household income in Burlington are the third lowest in the survey average of municipal comparators, thereby reflecting residential affordability as it relates to municipal taxes in relation to the current service levels
- The city has roughly the same level of tax spending as the peer average on a per capita basis. It will become increasingly difficult to reduce the increase in costs for providing municipal services at the current experience of inflation
Financial Position – Summary
Reserves and reserve funds when used in conjunction with debt policies are a critical component of a municipality’s long-term financial plan and financial health.
Reserves and reserve funds provide tax rate and cash flow stability when the City is faced with unforeseen or uncontrollable events. It ensures cash flows are sustained and allows for internal financing for temporary or one-time expenditures. Furthermore, these funds provide the City flexibility to manage debt levels and allows for planning future liabilities.
The city has four categories of reserves and reserve funds.
- Stabilization Reserves and Reserve Funds
- Capital Reserve Funds
- Corporate Reserves and Reserve Funds
- Program Specific Reserves and Reserve Funds
The city also maintains reserve funds for Local Boards, which were established in response to specific programs for each board. Their operating surpluses are used to fund their respective reserve funds.
Stabilization Reserves & Reserve Funds
These types of reserves and reserve funds are used to mitigate the risk of raising taxes or reducing service levels due to temporary revenue shortfalls or unanticipated expenditures. It is restricted to unforeseen or temporary events, which can include the previous year’s operating deficits.
Overall, the target balance for the consolidated stabilization reserve funds (excluding Building Permit Stabilization Reserve Fund) is set at 10%-15% of the City’s own source revenues. As of 2022, the consolidated balance of these reserve funds is below target at 9.3%.
Capital Reserve Funds
As stated in the City’s Strategic Plan, all city infrastructure will be maintained in a state of good condition. Annual contributions that are consistent and predictable to capital reserve funds is vital for the future rehabilitation and replacement of assets to be able to meet this goal.
The city’s capital reserve fund policy recommends that as a general principle a consolidated target for capital reserve funds should be a minimum balance of 2% of the total asset replacement value. Based on the city’s 2021 total asset replacement value of
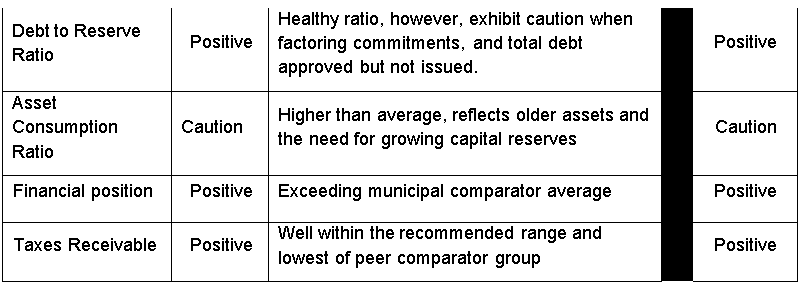
$5.2 billion, this equates to $104 million. As of 2022, the City’s uncommitted consolidated year-end balance in capital reserve funds is approximately $28 million, well below the intended target. Furthermore, the consolidated balance in capital reserve funds has decreased by 31% over the last five years.
Capital reserve funds are a critical component of the city’s 2021 long-term asset management financial plan (F-34-21) and are conservatively employed to minimize impact to financial flexibility and overall liquidity. Declining capital reserve funds along with escalating inflation and greater expectations of quality programs, as highlighted in Appendix A, suggest an increase to the dedicated levy at a quicker pace to avoid further increases in the infrastructure gap. This is in line with the recommendations in F-20-23, Asset Management Financing Plan Update, emphasizing continued importance on sustaining and growing the dedicated infrastructure levy to build reserves and create financial sustainability.
Corporate Reserves & Reserve Funds
These reserve and reserve funds are used to manage current costs that will be transferred to future generations, as the City incurs liabilities that do not have to be paid immediately.
Reserve funds in this category include the Employee Accident, Benefits and Insurance reserve funds.
Contributions to Corporate Reserve/Reserve Funds should take into consideration the liability associated with these funds. A sufficient budget allocation is required to fund the WSIB costs and employee benefits so that the Employee Accident Reserve Fund and Benefits Reserve Fund can eventually be replenished to cover the liabilities.
Program Specific Reserves & Reserve Funds
Program specific funds are established from time to time by Council based on needs of the community. Some examples are the Community Heritage, Culture, Forestry and numerous Parks & Recreation related reserve funds.
Growth Related Reserve Funds
Development charges (DC) will be applied to the full extent permitted by legislation. Currently, there are seven DC reserve funds under the city’s existing by-law for transportation, storm drainage, fire, transit, library, parks and recreation, and development related studies.
Community benefits charges (CBC) replace the former section 37 provisions under the Planning Act. Municipalities can use CBCs to fund capital costs, of any public service, that are related to the needs associated with new growth if those costs are not already recovered from development charges and parkland provisions.
Park dedication is used by the city to provide land for park or other public recreational purpose. This is accomplished through dedicated parkland as part of a development application or through cash-in-lieu received which the city uses to purchase land for parks and other recreational facilities.
Based on the financial assessment completed by Watson & Associates the passing of Bill 23 legislation will have a significant financial impact on the City’s revenue collection for development charges, community benefits charge, and park dedication (cash-in-lieu/land conveyance). This will restrict the city’s ability to fund growth-related infrastructure in a timely manner and exert pressure on the city’s operating budget to support complete communities.
Debt Management
The city’s debt policy limits the total debt charges as a percentage of net revenues to 12.5% (provincial legislated limit is 25%). As of December 31, 2022, the City’s total debt charges as a percentage of own source revenue is estimated to be 13.64% (as per report F-06-23 – Quarterly Status Report).
In 2020, in order to create a more flexible and adaptable policy, while continuing to allow for quality investment decisions, meet legislative obligations and respond to community needs in a timely manner, the city updated its debt policy to provide for a temporary overage. The city’s debt policy contains an allowance to temporarily exceed the 12.5% to a maximum of 15% for no more than three (3) consecutive years. The corresponding recovery from the overage should also be sustained for a minimum of three years. The city’s current debt limit is within the parameters as defined by the policy.
The city makes every effort to minimize the impact of debt-servicing costs and manage future debt levels. Debt financing is primarily limited to specific project types such as new capital initiatives, land acquisitions, projects tied to third-party matching funds and should be considered only as a last resort for asset replacement as per the city’s debt policy.
As master plans are coming to completion, and the city is working towards updating the Multi-Year Community Investment Plan (MCIP), the city expects to see elevated debt levels to assist in implementation of community needs. Prioritization and sequencing of capital needs will be imperative to use the city’s debt capacity and reserve funds most effectively.
Highlights
-
The City’s reserves and reserve funds (excluding obligatory reserve funds) have increased by 5.5% since 2018.
- The consolidated 2022 stabilization reserve fund balance as a percentage of own source revenues (excluding the Building Permit reserve fund) is below the targeted range of 10-15%, and currently at 9.3%
- Unfunded liabilities continue to exist in the city’s corporate reserves. Since liabilities do not come due at the same time, it is reasonable to have some unfunded liabilities, yet gradually address the liabilities to ensure it does not continue to grow
- Asset Consumption ratio is higher than the peer average reflective of older assets and the need to increase the city’s capital reserve The consolidated balance in the capital reserve funds has decreased by 31% since 2018.
Strategy/process/risk
Challenges & Risks in the BMA report
In summary, the City in many respects continues to maintain a strong financial position, however, there are key areas identified throughout the report which require close attention. Further challenges lie ahead that will undoubtedly lead to financial risk and requires on-going monitoring. As evidenced in the report, the city relies heavily on property taxes to manage the city’s day to day operations, however, these revenues are being stretched as a result of limited assessment growth and increasing service demands displayed by a changing demographic and intensification. Growth in the city will only continue and moving forward the city’s growth funding tools are being limited by provincial regulations namely impacting development charges, and park dedication revenues. This affects the city’s ability to provide capital infrastructure to support growth in communities in a timely manner and places an increasing reliance on the city’s existing assets to deliver service.
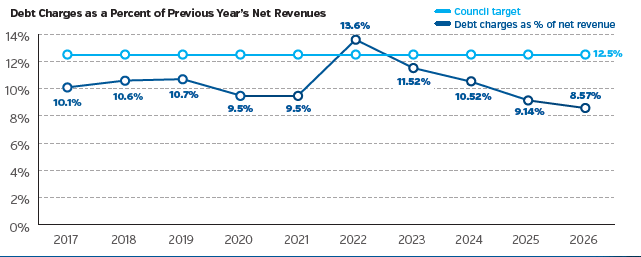 This results in further pressure on the city’s tax revenues firstly, to support increasing debt financing costs for future capital investments and secondly, by way of accelerating the dedicated infrastructure levy to combat cost pressures, manage an increasing infrastructure gap, and to adequately contribute to capital reserves to support the aging infrastructure.
The City recognizes the need to re-evaluate the decisions around municipal finance and where necessary modify the plan to ensure the sustainability of the city’s financial capacity. Prioritization and sequencing of community investments will be of utmost importance to effectively utilize the city’s debt capacity and ensure reserve fund balances over the long-term continue to deliver value-added services to residents. To assist in this regard, preparation of a long-term financial plan should be considered to consolidate the various challenges and opportunities in one platform.
Next Steps
As concluded above, significant financial challenges are ahead for the City of Burlington as objectives of increasing growth, enhancing services and rising inflation collide. It will be important for the city to prioritize and sequence community needs to keep taxes affordable while effectively delivering services to the community. Moving forward, the city is updating its Multi-year Community Investment Plan to provide a thorough view of capital needs that are being brought forward with the completion of major master plans and strategies. Staff anticipate bringing forward a list of needs that are sequenced over a long- term planning horizon with an evaluation of existing funding sources to assist in the implementation of the city’s overall strategic objectives.
Furthermore, staff will be working towards bringing a comprehensive long-term financial planning document forward as per BMA’s recommendation above. Together, the multi- year community investment plan (MCIP), 2025 Asset Management Financial Plan and the multi-year operating budget simulation will provide a holistic view of the multiple financing strategies, the fundamental needs, and overall management of risk considered into one platform; ultimately, aligning with the strategic objectives of the city’s approved long-term financial planning framework. Staff anticipate bringing this forward in Q1 2025, to coincide with the completion of individual financial plans and related strategies.
Financial Matters:
The Financial Health Report prepared by BMA Management Consulting Inc. was completed at a cost of $28,500, which was funded by Financial Management Services’ operating budget.
Engagement Matters:
The results of this study will be shared with the Treasurer/Director of Finance from each of the seven comparator municipalities and the Region of Halton.
No mention of plans to share it with the public.








Just a little skeptical and cautious given previous misleading information from the City of Burlington … It would be great to use an objective 3rd party that compares municipalities without having any other affiliation with the municipalities. This would be an improvement over BMA which executes several other paid for studies for the City of Burlington. Bottom line: Tighten your belts City of Burlington Council and provide a “needs based” not “want based” budget that is funded through cost savings and new revenue generation rather than a continuing trend of high property taxes increases. Aim for a BHAG 0% based budget and maybe end at 1-3% max. increase.
Richness of assesment base = Strong assessment base upon which to raise taxes.
Interpretation{ Burlington residents are loaded, therefore they can easily AFFORD, 10% of more hikes.
BMA are the go to firm for municipal studies. As such they wont bite the hand that feeds them. The BMA 2023 full study results for Cambridge can be found on line. Why are we being spoon fed 2022 study results? Based on this navel gazing study we can expect COB to jack up the 2024-25 budget.