


 By Pepper Parr
January 31st, 2024
BURLINGTON, ON
We neglected to give credit where credit was due. The report was written by Community Development Halton. The full report, Community Data Watch, Where is Poverty in Halton, January 2024 can be found at: Community Data Watch: Where is Poverty in Halton? | Community Development Halton (cdhalton.ca)
In 2020, there were over 34,000 people living in poverty in Halton.
There were about 7,300 individuals living in poverty in Burlington’s 47 census tracts. Nearly 80% of the census tracts had less than 215 individuals. The other 20% of census tracts were with poverty population level ranging between 216 and 450 individuals.
Almost half (49.7%) of the people living in poverty re-sided in Oakville, followed by Burlington (21%), Milton (21%), and Halton Hills (8%)
A census tract (CT) is a small, relatively stable geographic area that usually has a population of between 2,500 and 8,000 persons.4 However, there is one exception, the census tract which includes North Oakville has a population of over 21,000 in the 2021 Census. This census tract has yet to be subdivided. According to Statistics Canada, a census tract may be split into two or more new census tracts (usually when its population exceeds 8,000).
Halton’s poverty rate as measured by Canada’s official poverty was 5.9% compared with the provincial average of 8.3%. The measure used throughout this article is the Market Basket Measure
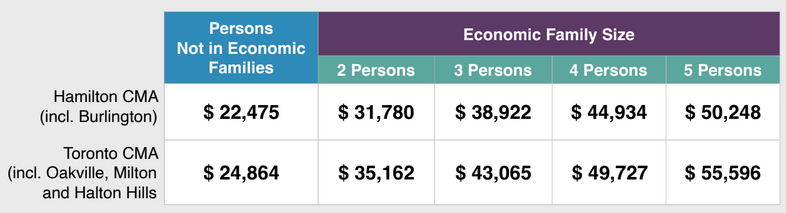
The amount of income needed to be above the poverty line.
The graphic provides detail on the poverty threshold, or the minimum level of income deemed necessary for a basic standard of living, using the Market Basket Measure, Canada, and Ontario’s official poverty measure.
The intention of this spatial analysis of data is to provide further insights into the dynamics of poverty and its impact on both individuals and the community. It raises public awareness on income and social inequalities, and serves as a communication tool to facilitate community discussions, gather input from residents, and involve them in the decision-making process regarding the types of services needed.
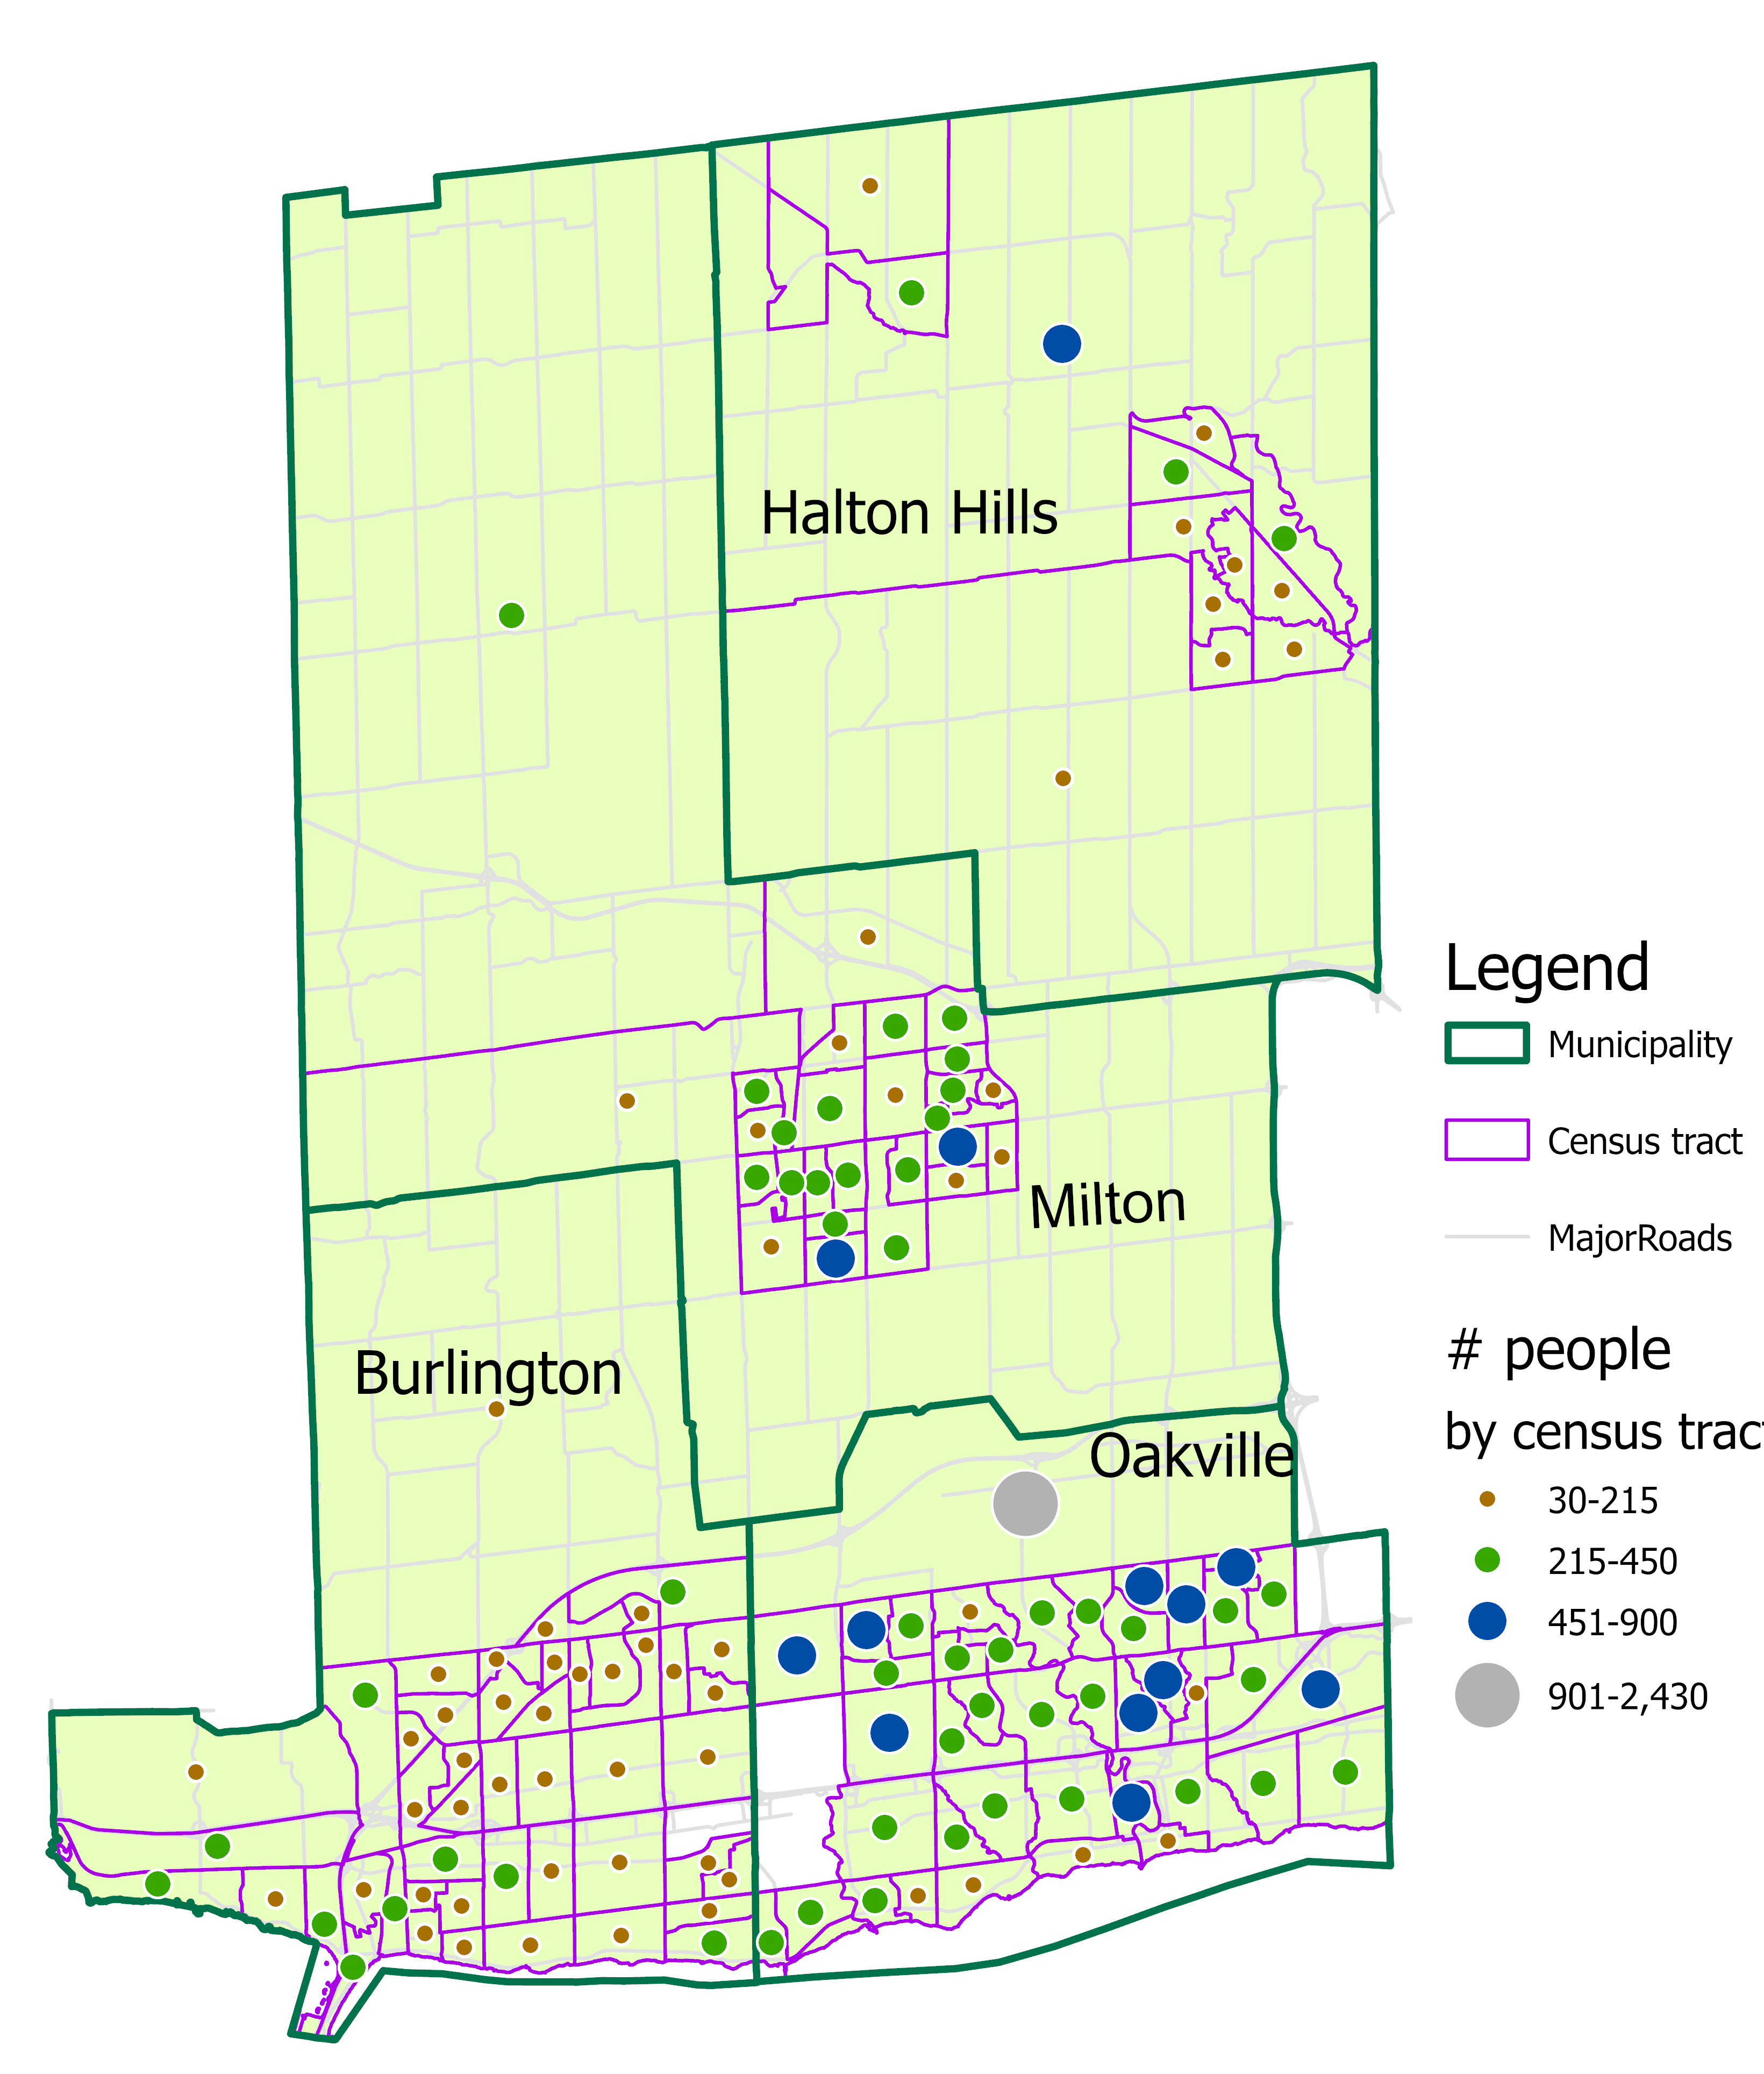
The map shows the number of people living below the poverty line by census tract (outlined in purple) in Halton.
In the 2021 Census, there were 131 census tracts in Halton of which three were non-residential areas.
Community organizations can use the geographic data to design or update existing community development programs and services especially where proximity and accessibility are important.
This enables them to focus on areas with the greatest need and engage with residents to develop effective solutions. It can foster partnerships with local organizations, businesses, and government agencies to pool resources and expertise to alleviate poverty.
See the following for more information on poverty in Halton and how it is measured: Community Development Halton, Our Halton, Income
Statistics Canada, Census Tract:
Census tract: Detailed definition

Discover more from Burlington Gazette - Local News, Politics, Community
Subscribe to get the latest posts sent to your email.

Maybe the Mayor & City Council members can invite the people living in poverty in the city to the opening of the renovated civic square, (that their ramming through), when its completed & explain to them why IT was more important to throw millions of $$$ at than perhaps considering using such a useless expenditure in addressing & perhaps easing the poverty issue.
Please see https://cdhalton.ca/2023/10/02/our-halton-2023-income-inequality-poverty/ for more information on Income Inequality and Poverty in Halton. There you can read about the impact of income supports during the pandemic on decreasing poverty rates. That publication also provides data on increased poverty since those income supports have come to an end. You are correct that the numbers are now higher, with the impact the community is facing with inflation. This report on the geography of poverty is intended to help with planning and collaboration to address poverty.
This is 2020? We know from the recent excellent delegation by Lydia Thomas that Burlington’s food bank use has since skyrocketed. I expect these numbers are much higher now, in Burlington as well. But council continues spending money on unnecessary items and raising property taxes far higher than they claim to be, regardless.
Surely there are not greater than 450 people living in poverty on the property between Dundas St and Bronte Provincial Park in north west Oakville. It looks sparsely populated.