 By Pepper Parr
June 2, 2015
BURLINGTON, ON
Part two of a series
In the municipal world the vision gets some attention – it is the pot holes and the snow clearance that crate all the squawking.
How has Burlington done in the eyes of the 771 people who were polled by Forum Research in February – 771 interviews was seen as statistically valid – on the quality of the services city hall delivers?
In this part two of a series on the polling that was done we set out what Forum Research learned. The results of the research will guide the |Strategic Plan deliberations that are taking place now.
How satisfied were residents with the services provided overall?
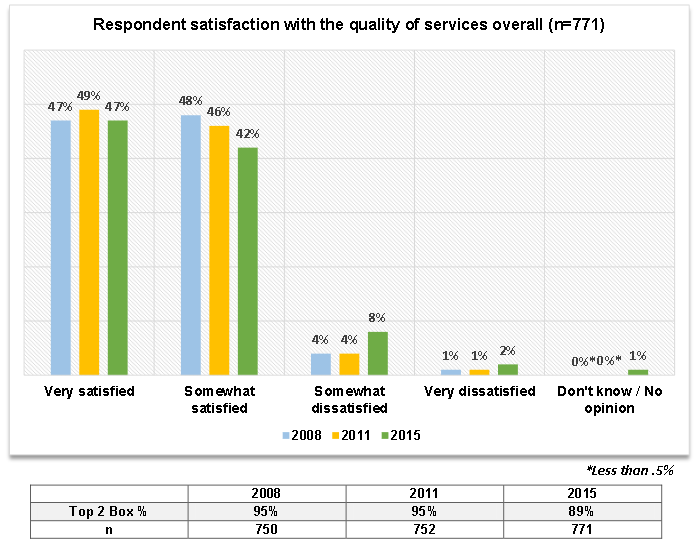 When respondents were asked to rate their satisfaction with services overall, the large majority said they were ‘very’ or ‘somewhat’ satisfied (47% and 42%, respectively). Compared historically to 2008 and 2011, there was a small movement of respondents from being somewhat satisfied to being somewhat dissatisfied. Respondents who were ‘somewhat satisfied’ decreased 6% since 2008 and 4% since 2011; at the same time, respondents who were ‘somewhat dissatisfied’ increased by 4% since 2008 and 2011. Despite this small increase, satisfaction with services in Burlington overall remains strong.
Satisfaction with Public Safety Services
Forum Research began to drill down into some of the responses and asked how people felt about specific services.
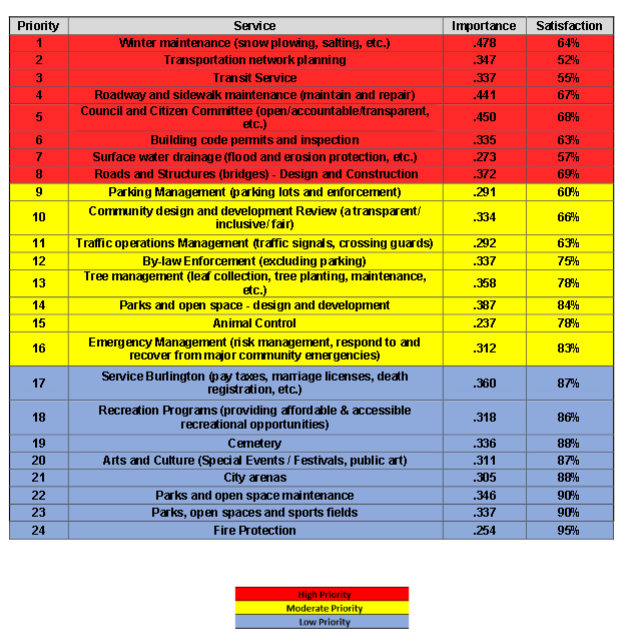
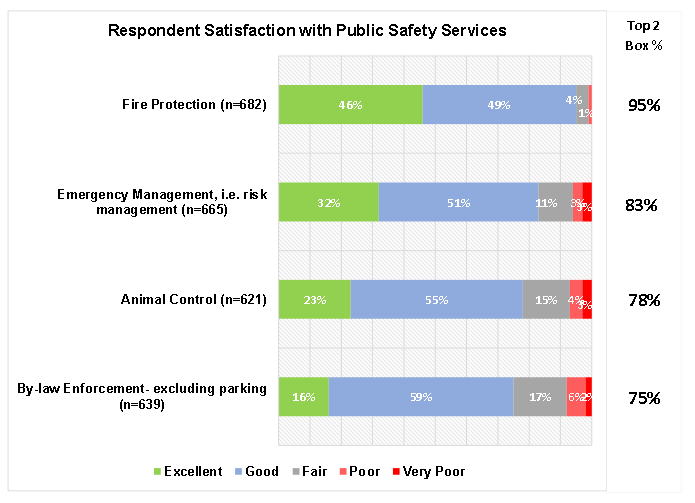 Respondents were asked to rate their satisfaction with various Public Safety Services by indicating either excellent, good, fair, poor, or very poor. Looking at top 2 box responses (excellent/good), the highest satisfaction ratings were recorded for fire protection services (95%), and emergency management (83%).
Satisfaction with Maintenance Services
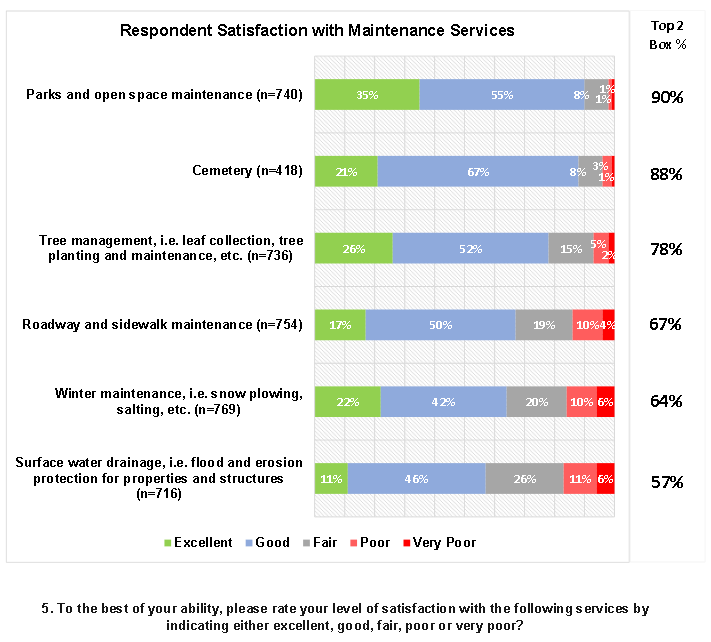 Respondents were asked to rate their satisfaction with various maintenance services offered by the City of Burlington. Looking at top two box responses (excellent/good), the highest satisfaction ratings were recorded for parks and open space maintenance (90%), cemetery maintenance (88%), and tree management (78%). Lowest satisfaction was recorded for surface water drainage, i.e. flood erosion protection for properties and structures (57%).
Satisfaction with Roads and Transportation Services
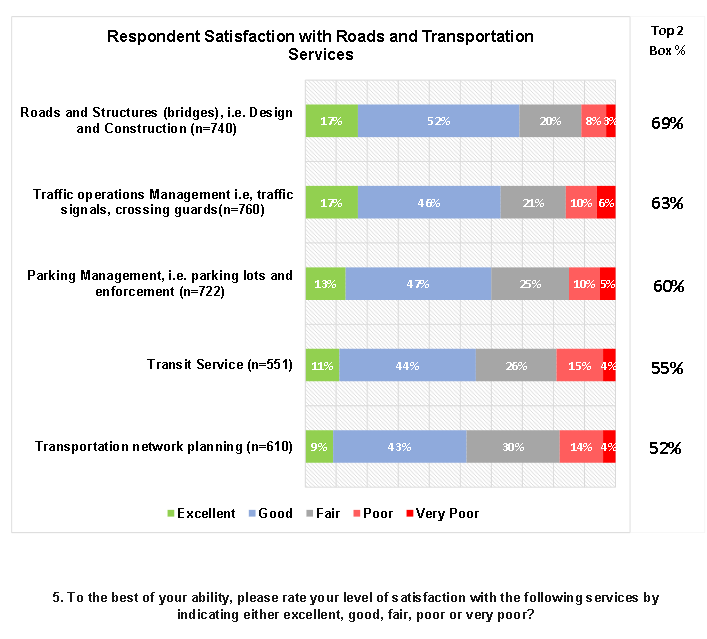 Looking at top 2 box responses (excellent/poor) for roads and transportation services, the highest ratings were recorded for roads and structures, i.e. design and construction (69%), as well as traffic operations management, i.e. traffic signals and crossing guards (63%). Lowest satisfaction ratings were recorded for transportation and network planning (52%), as well as transit services (55%).
Satisfaction with Leisure Facilities, Programs and Events
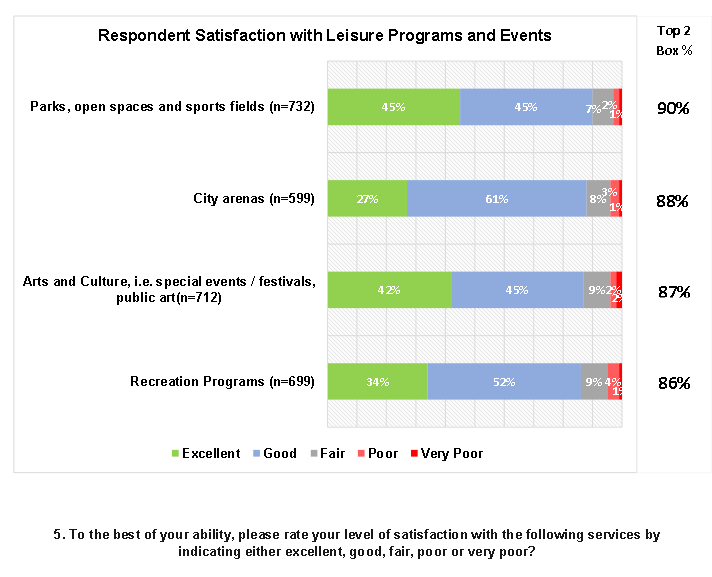 When respondents were asked about their satisfaction with leisure facilities, programs and events offered by the City of Burlington, a strong majority of respondents rated all items as ‘excellent’ or ‘good’. However, the highest level of satisfaction was recorded for parks, open spaces and sports fields (90%).
Design and Building Services
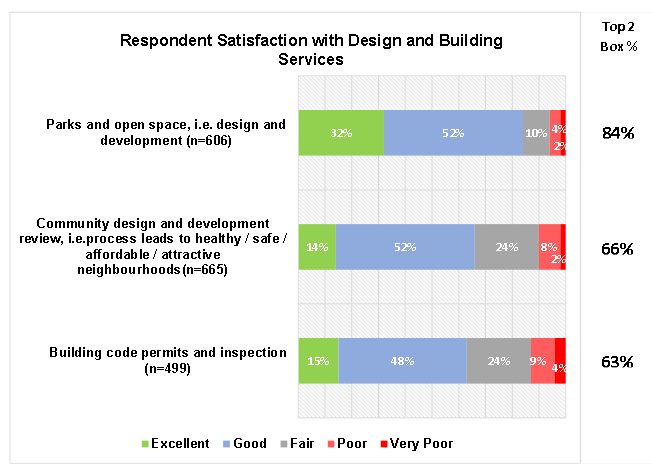 When it comes to services related to design and building in the City of Burlington, 84% of respondents said parks and open green space, i.e. design and development was ‘excellent’ or ‘good’ (32% and 52%, respectively). Looking at top two box responses (excellent/good), the majority of respondents were also satisfied with community design and development review (66%) as well as building code permits and inspection (63%).
Satisfaction with Emergency and Disaster Assistance
It was important to measure how much confidence residents have in the ability of City of Burlington to provide effective assistance in the event of a major emergency or disaster. The majority of respondents (60%) said they were ‘somewhat confident’ and 29% said they were ‘very confident’. Worth noting is that 1 in 10 respondents said they were ‘not at all confident’.
Feedback to Improve Resident Confidence in Emergency Preparedness
When respondents were asked what the City could do to make them feel more confident in the event of a major emergency or disaster, the largest proportion of respondents said to communicate the disaster preparedness plan to the public (22%). Other top mentions included: educate the public on what to do in the event of an emergency or disaster (11%), as well as communicate / raise public awareness more generally (9%).
City Communication and Support for Emergency Preparedness
Respondents were asked whether or not the City of Burlington is encouraging and supporting emergency and disaster preparedness within the community. The majority (61%) said it is, while 23% said the City it is not.
Top Priorities amongst Respondents
Respondents were asked to rate on a scale of 1 to 10 (1=low priority, 10=high priority), how much of a priority various issues are for the City to focus its attention on. Items that were of highest priority (rated 8, 9 or 10), were: community safety (76%), commitment to infrastructure (76%), healthy community (73%), sound financial practices (69%), as well as parks and community open/green spaces (69%). More attention most members wanted to admit was asked for on open, transparent and accountable civic government.
As the city gets into detail and specifics on the Strategic Plan that will guide their efforts for the next three years expect those that are colour coded red to get a lot of attention.
