By Staff
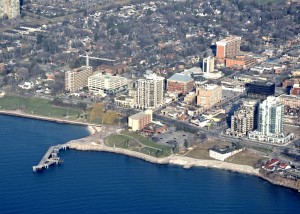
BURLINGTON, ON March 30, 2011 – This is really hard to believe but maybe they didn’t know about the “mistake on the Lake”. Whatever, Burlington is still seen as the third best place to live in Canada by MoneySense. This is the second time we have been given this award.
In a city press release we are told that “The City of Burlington is fortunate to have the Niagara Escarpment, a world-recognized natural feature, as well as Lake Ontario in our backyard,” said Mayor Rick Goldring. “We are a city with low crime, and high community engagement. Our citizens get involved and help make Burlington the beautiful city it is, and a great place to live, work and play.”
Burlington came in Ottawa-Gatineau and Victoria, BC and is the only GTA city to appear in the top 10. In 2010, Money Sense also named Burlington the third best city in Canada, up from fourth in 2009 and eighth in 2008.
“We keep getting better,” said Kyle Benham, Executive Director of the Burlington Economic Development Corporation. “Economies succeed based on the availability of a talented workforce. When you are one of the best places to live, it helps to attract and retain the work force needed for today and into the future.”
Money Sense measured 180 cities, up from 179 last year. To come up with the ranking, Money Sense gathered information on Census Metropolitan Areas (CMA) and Census Agglomeration areas that had a population of 10,000 or greater (and for which the required data was available). They then broke up the CMAs of Toronto, Montreal, Vancouver, Quebec City, Hamilton, St. Catharine’s-Niagara, Oshawa, Edmonton and Kitchener into their component cities of 50,000 or more in population.
Money Sense grades cities in categories that include:
- Walk/Bike to Work: This represents the percentage of people who walked or took their bike to work.
- Weather: Ideal volume of precipitation is considered to be 700 ml per year. Source: Environment Canada.
- Air quality: Data was from monitoring stations in or nearest to each city as reported by the National Air Pollution Surveillance Network.
- Population growth: Higher creates problems, lower means less opportunities. Cities with negative growth received 0 points. 2006 figures from Statistics Canada.
- Unemployment: 2010 data from Statistics Canada when provided and 2011 estimates derived from Canadian Demographics.
- Housing: Average house average prices from reports and listings by MLS, Canadian Real Estate Association, and the Real Estate Boards of Toronto, Fraser Valley, Vancouver and Quebec. Time to buy was derived from average price divided by average 2011 estimated household income sourced from Canadian Demographics.
- Household income: 2011 estimates as per Canadian Demographics.
- Discretionary income: Discretionary household income as a percentage of total household income derived from 2011 estimates as per Canadian Demographics.
- New cars: 2008-2010 model year vehicles as a percent of total vehicles as per Canadian Demographics.
- Income taxes: Cities ranked (lower is better) according to the rate of combined federal and provincial (or territorial) income tax paid on a single person income of $50,000 as per www.taxtips.ca.
- Sales taxes: Cities ranked (lower is better) according to the rate of provincial or territorial sales tax.
- Crime: Violent crime rates, total crime rates per 100,000 people and crime severity rates for 2009 from the Canadian Centre for Justice Statistics. (Lower is better in all three cases.)
- Doctors: Number of general practice and specialist physicians per community provided by the Canadian Medical Association and converted to doctors per 1,000 people.
- Health professionals: Percentage of people in each city who are employed in health occupations according to the 2006 census.
- Transit: Based on the percentage of the workforce utilizing public transit according to the 2006 census.
- Amenities: One point each for a hospital, university and college.
- Culture: Based on the percentage of people employed in arts, culture, recreation and sports.
Not quite sure how many points we got for people taking transit to work – that doesn’t seem to fit with the conversations around transit at council committee meetings.
Now, if that Pier were built can you just imagine – we could have been THE best place to live in Canada – and what if the Ti-Cats had decided to call Aldershot home? We would have become just impossible to live with.
[retweet]


