August 16th, 2019
BURLINGTON, ON
The Gazette has been doing a series of articles on the amount of money that was raised and spent during the October municipal election.
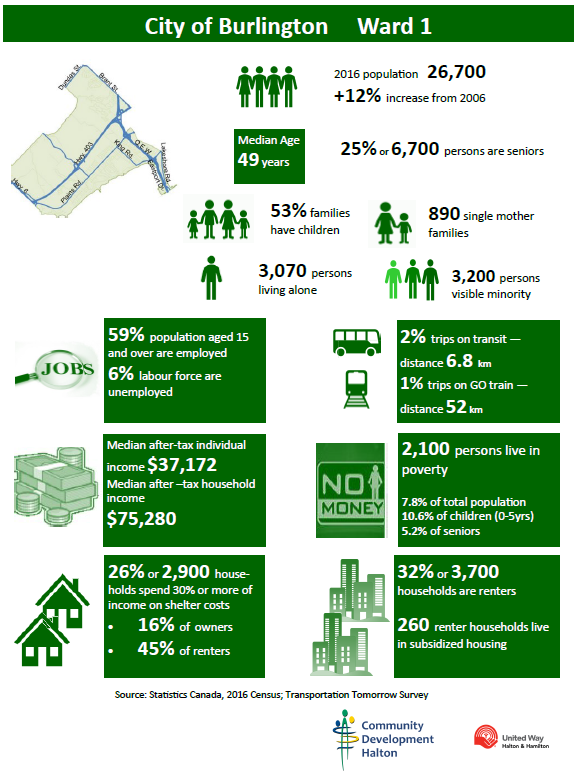
We are going to do this on a ward by ward basis and at the same time provide some demographic data on the makeup of the ward. Reports have been done on wards 3 and 4.
The demographic data will give readers a drilled down look at the community they live in and how their member of Council got elected and who paid for that election.
Ward 1 is being done in two parts; the well-financed campaigns and candidates that got decent vote counts and those who were running for reasons known only to themselves.
Each candidate was given an amount they could spend; that number came for the Clerk’s office who used Statistics Canada numbers.
In the data set out below the TCI (Total Campaign Income) is the total dollar amount brought in by each campaign. The TAE (Total Applicable Expenditures) is the TCI minus any applicable expenses. It is the total applicable expenditures or the total expenditures that apply to the Total Spending Limit and must be less that the Total Spending Limit. We then took the TAE and calculated it as a % of the TSL (also called “The General Spending Limit). So if someone had a TAE of $7 and the TSL/GSL was $10, then they spent 70% of the allowable campaign limit.
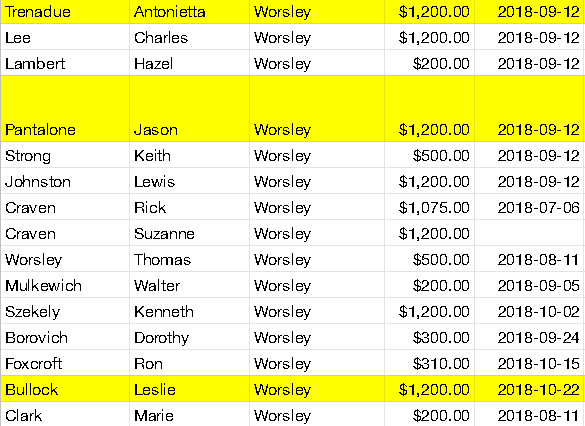
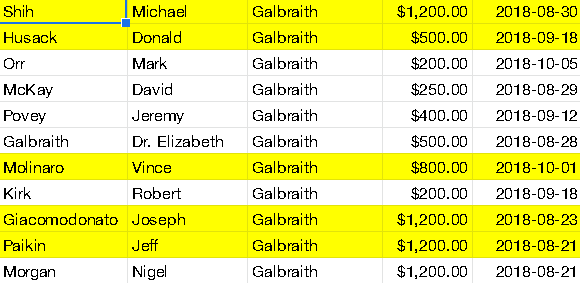
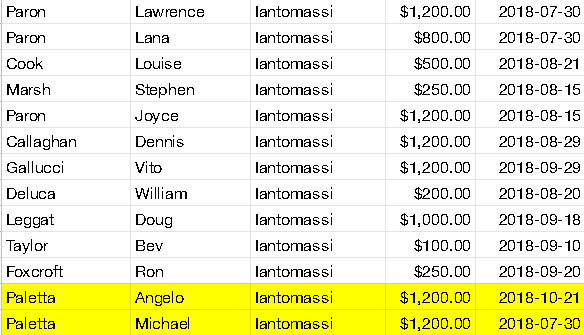
Campaign donations. The numbers in yellow are donations that came from people believed to be developers.
Judy Worsley campaign donations:
Kelven Galbraith campaign donations:
Marty Staz campaign donations:
Arlene Iantomassi campaign donations
Did funds from developers make a difference? It wouldn’t appear so.
At look at the demographic make up of the ward.







I would like to see a geographic poll by poll report on voter activity for the ward.
Editor’s note: I am sure you would. And you expect us to do all that slogging for you?