


 By Pepper Parr
April 29, 2015
BURLINGTON, ON
The creation of the strategic Plan for the next three years began Tuesday morning at the LaSalle Pavilion. Council and senior city staff met as a Committee of the Whole and while these occasions are public meetings – there wasn’t a member of the pure public in the room.
The Gazette was the only media in the room as well. There were two representatives from community Development Halton taking part in the presentation of a social profile of Burlington.
 What became clear quite early is that the development of the Strategic Plan and the completion of the Official Plan are being done hand in hand – each is going to inform the other.
Who lives in Burlington; who is going to live in Burlington and where will they want to live? These were the prime questions put before the meeting of about 40 people.
Community Development Halton put together a very detailed profile of who we are and what we are worth. This data was set out as the base upon which both the Official Plan and the Strategic Plan are going to be created.
None of this is going to happen in 90 days – the public may not see a completed Strategic Plan until sometime in October.
There will be more public involvement in the 2015 Strategic Plan than there was in the 2011 Plan. The city created a workbook that was made available to anyone who asked. At one point there were just 35 completed but that number “zoomed up to 90.
Knowing what is probably going to be needed in the way of housing tells the planners what kind of development they want to encourage – and developments do get encouraged.
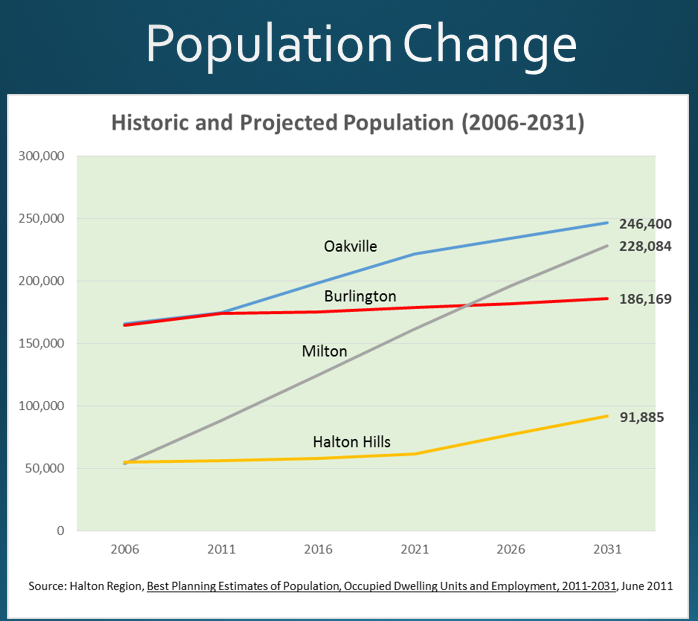
Burlington population growth has flat lined, Milton is sky rocketing and Oakville is pulling ahead. These projections have significant political and economic implications – the Region may well decide that more of the population coming into the Region should land in Burlington.
A presentation of 24 slides told the story – the first was a look at the historic population of the municipalities in the Region
There was a time said Mayor Goldring when Burlington was bigger than Oakville however since then Burlington’s growth has basically flat lined while Milton has grown very rapidly.
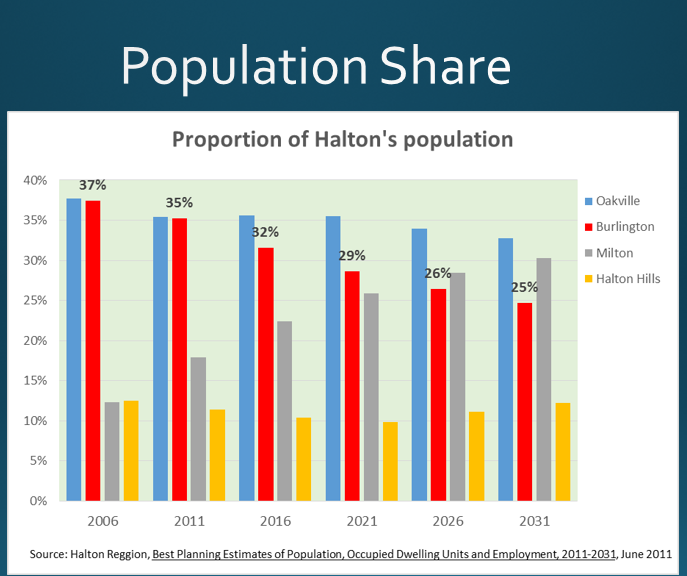
Our portion of the Region’s population is shrinking while that of Milton has skyrocketed. When the 2016 census data is available the Region is required to look at where people live and re-balance the political representation at the Region. Burlington’s political clout will be based on the number of Regional Councillors. Right now every member of city council is also a regional Councillor. The make up of out city council could undergo a significant change.clout
The way population was shared within the Region was interesting.
The change in where people lived is shown in #3. Some communities remained stable while others experienced significant growth. The red dot in the upper half is the creation of the community of Alton.
A large part of the discussion around population was the provincial requirement that population grow in the Region. The province requires Halton to grow and the Region determines where that population was going to go in each municipality.
Each municipality then determines where it is going to put the population growth in its municipality.
One point that got made several times was that Burlington’s growth would be done by intensification and that the older traditional communities would not undergo any intensification.
Mayor Goldring talks about the city being built out – Ward 2 Councillor Meed Ward says the city has hundreds of acres of land. One would expect they would both have access to the same data – apparently not.
Every conversation about population growth refers to the seniors and how that demographic is growing. The Molinaro Paradign project that will have five towers next to the GO station on Fairview is not going to house than many seniors – but the mental focus is still on the seniors.
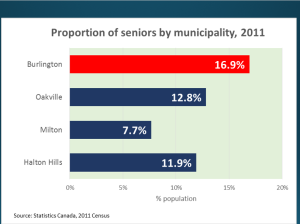
Burlington clearly has the largest percentage of seniors and at the same time we have some of the highest rents and the lowest vacancies. The need for some deep understanding of the demographics of the community became obvious.
Here is what we know: The senior population increased by 17% to 29,720 between 2006 and 2011. The seniors represent 16.9 % of the population seniors over 80 have increased by 21% More than 62% of older seniors are female and 1 in 4 seniors live alone.
What kind of money do these people have? The median income for seniors is $33,280 and the median income for everyone is $40,180
In 2010, 64% of female seniors had incomes of less than $35,000; of the male population that percentage was 38.
The number of children living at home had some surprises – the definition of children for this exercise included people more than 25 years of age.
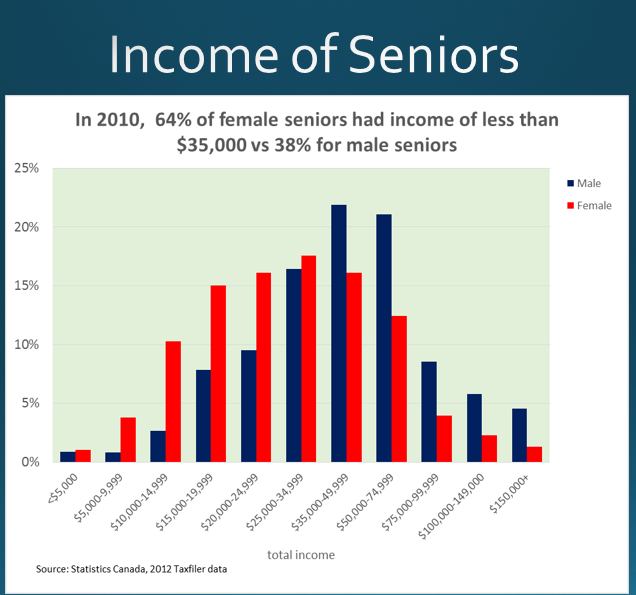
There were more female seniors with incomes of less than $35,000 than there were male seniors. Income was defined as that which is shown on tax returns.
With older children living with their parents the number of people in a household by themselves was close to astonishing.
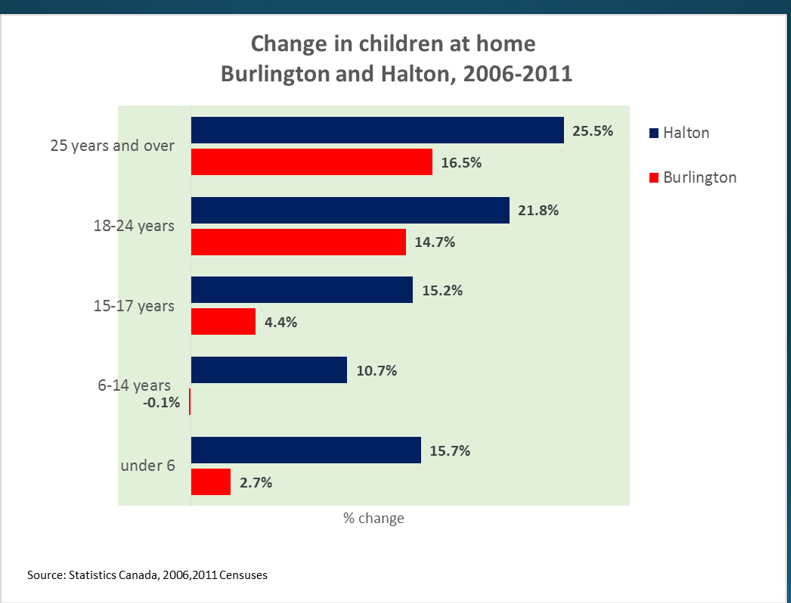
The number of people over 25 living with their parents is a little on the alarming side. The discussion on this data centered around whether or not this was going to continue or if it is a short term situation.
Some of the growth in Burlington is going to come through immigration. The Community Development Halton Development identified the sources of that immigration – it amounts to less than 2000 people
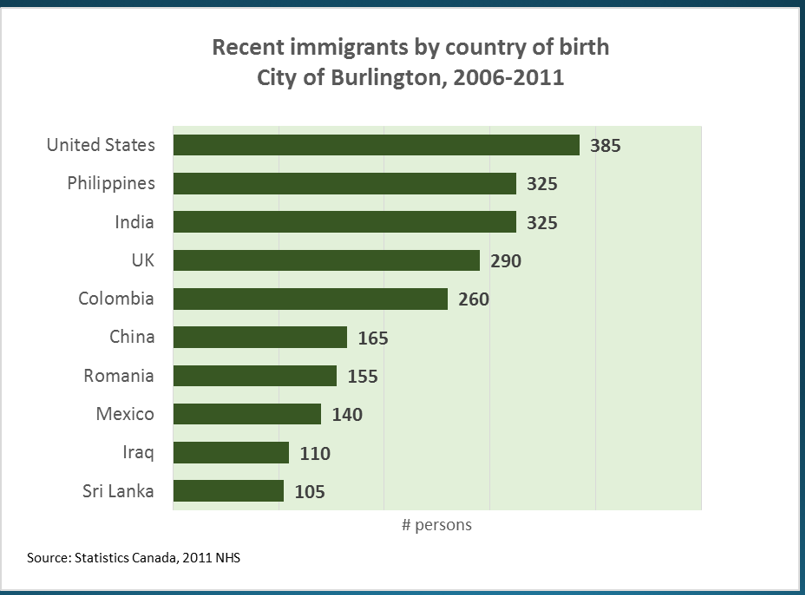
Immigration into the Region by country of birth. The total is in the 2000 range which the bulk coming from the United States
How is income distributed in Burlington? Everyone has always said Burlington is a wealthy city – the data supports that belief.
On the flip side of the very wealthy is identifying the poor; 9.5% of the population in Burlington is poor.
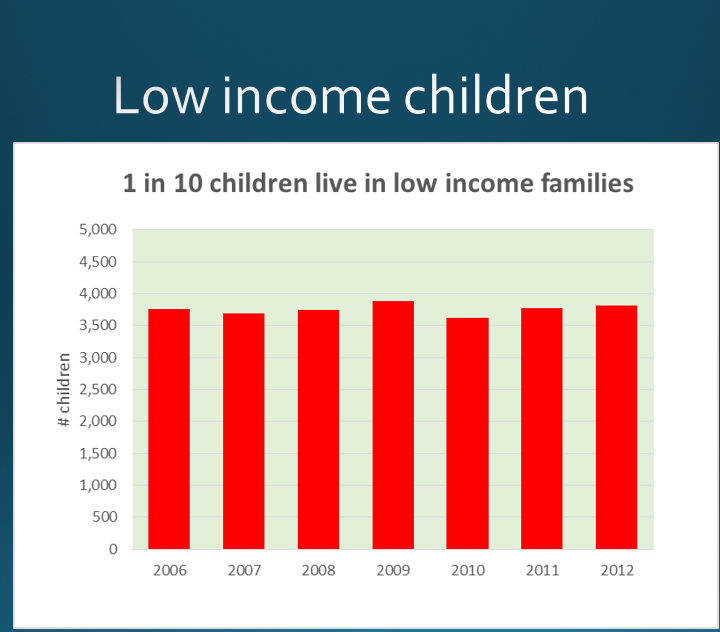
It would be useful to understand why the number of low income children has remained close to static even though population has grown.
The number of low income children has been pretty consistent the past seven years – why? That question did not come up. We seem to have accepted that we just have them.
The prevalence of low income people is also interesting. It shot up during the recession in 2009 but never really came down to pre-recession levels.
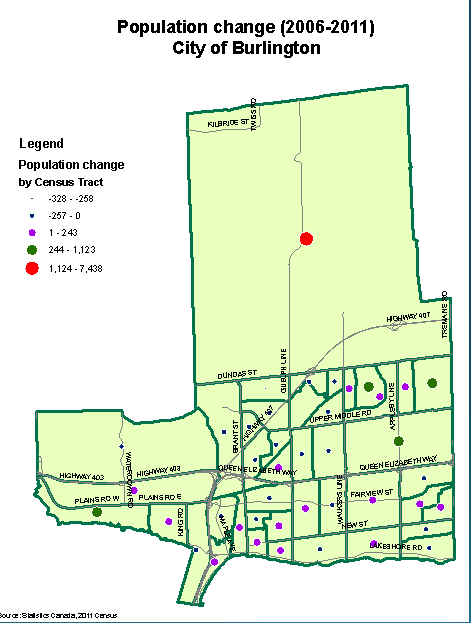
The numbers beside the dots indicates the level of growth. That big red dot reflects the growth in Alton.
Where does that low income population live? In Burlington we can’t say below the tracks – there are tracks all over the place – but there are clearly identified pockets of low income families
There is a link between the working poor and the amount of affordable housing in the city. That link is not fully understood by the community.
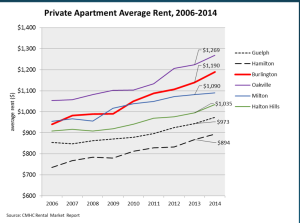
Rents are experiencing excellent growth – great if you are a landlord. Many of the new developments are being marketed as condominiums that are bought by investors and rented.
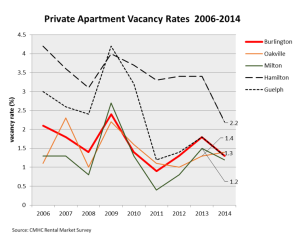
Apartment vacancy rates are very tight throughout the Region and is Hamilton as well.
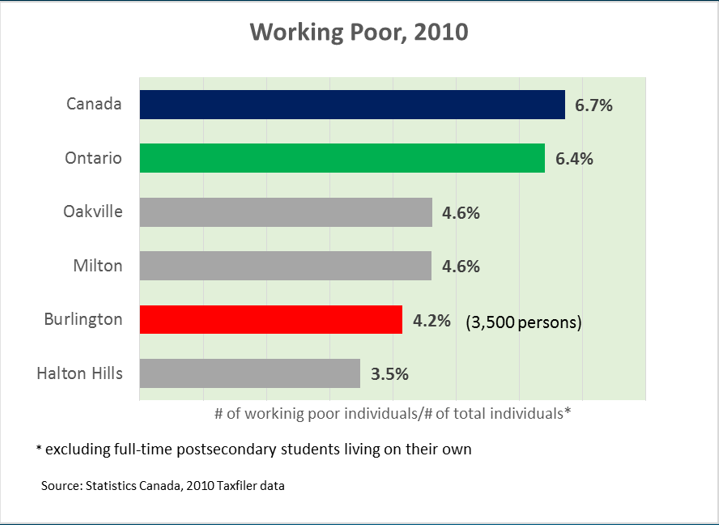
Burlington’s working poor as a percentage of the population compared with other jurisdictions – Burlington is low on that scale – at 4.2% – which is 3,500 persons.
Owning an apartment building is a solid investment in the Region. Rents have experienced a solid climb – well in excess of inflation. The difference between Burlington and Hamilton explains why people will drive to get to Burlington every work day.
The vacancy rate is very tight throughout the Region and in Hamilton as well. A 3% vacancy rate is seen as a healthy, balanced market.
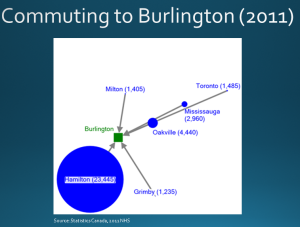
The number of people who commute TO Burlington from Hamilton is very high. A deeper understanding of the dynamics behind these commutes is probably needed.
The number of trips made by people in Burlington to their jobs outside Burlington and the number of people who drive to Burlington to work is really interesting.
What isn’t clear is the why of those trips. Do people drive to Burlington from Hamilton because rents are cheaper in Hamilton.
Do people drive from Burlington to other places because that is where the jobs are?
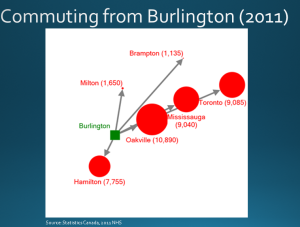
The traffic out of the city is due in some degree to employment opportunities. The city has yet to find the formula that will attract employers and reduce the commutes out of the city.
The belief is that people who work outside the city are less likely to be engaged with activities in the city – which was put out as part of the reason voter turnout is so low – it has been a consistent mid thirty percent range.
And yet the percentage of people who volunteer is very high in Halton – at the 50% level. The population is relatively generous – a smidgen lower than the Ontario average and lower than Oakville
Understanding the shifts that take place in population: immigrants coming into the country; seniors moving out of large homes into smaller townhouses or condos; young people renting their first apartment and the working poor looking for affordable housing is the work of demographers – Burlington doesn’t have one.
Windsor, a city with a population of 600,000 has six demographers on staff which prompted planner Bruce Krushelnicki to extrapolate that and come to the conclusion that Burlington should have two – Krushelnicki would settle for one.
A solid understanding of what Burlington has in the way of population, how that population is likely to shift and what future population might be are the building blocks on which the Official Plan and the Strategic Plan will be built.
That process has now begun – by the end of the year city council and the public will have had the time needed to ensure that everyone at least understands what those plans are – getting them to agree is another matter.

Discover more from Burlington Gazette - Local News, Politics, Community
Subscribe to get the latest posts sent to your email.

Hi Pepper
Good article and use of charts. One small correction the City of Windsor only has 210,000 people according to the 2011 census not 600,000 and it declined by over 5000 people since the 2006 census. Check out this link for more information. https://en.wikipedia.org/wiki/List_of_the_100_largest_municipalities_in_Canada_by_population
Colin Best
Local & regional Councillor
Milton/Halton