


 By Pepper Parr
February 3rd, 2021
BURLINGTON, ON
Is there less traffic on the streets?
What has the traffic volume curve looked like ?
What do you make of that? Does the curve represent your traffic pattern?
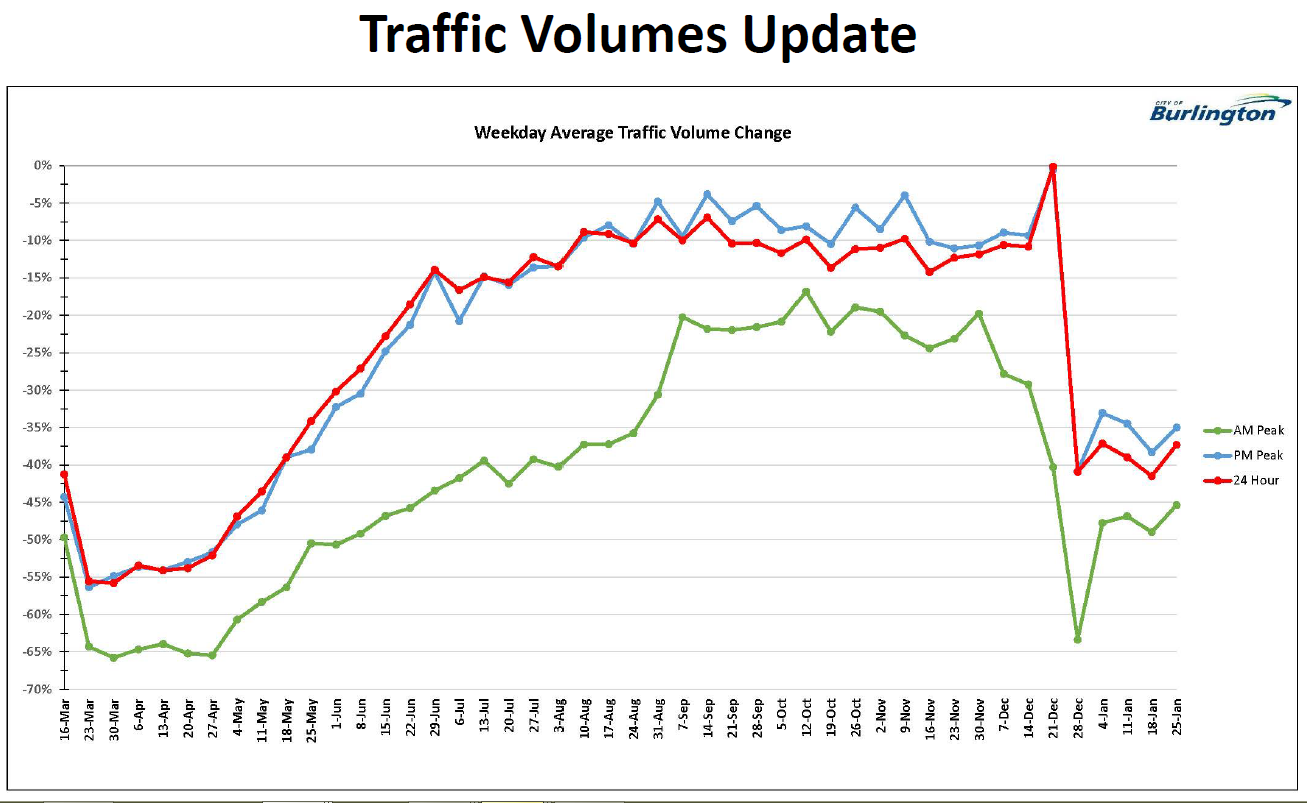
Director of Transportation, Vito Tolone. told Council today that Traffic Volumes on Burlington Roadways during the lock downs has been volatile.
• Traffic sensors have been collecting volume data from various permanent count stations situated on arterial roadways across the City
• Volume data for Tuesday through Thursday is taken from each station as a “typical day”, totaled for each period (am, pm, 24hr) and averaged to get a “weekly average” for each period
Traffic is certainly lighter during the lock downs.
Highlights:
• March 2020 traffic volumes decreased significantly by 40-45 per cent
• June to December 2020 – traffic volumes steadily increased to reach almost 95 per cent of pre-COVID volumes
• Following Province wide shut down, 2021 volumes have again decreased by 35– 40 per cent.
Transit Volumes Update
• Ridership has been recovering since April 2020 as the economy re-opens from the 1st Provincial Lockdown
• A new schedule went into effect since late August 2020
– Enhanced midday service on New St, Plains Rd, Fairview St, and Industrial Area
– 15 minute or better service on New St, Plains Rd, and Fairview St (Route 1, 10)
• Dec 2020 ridership was 67.5% of pre-COVID levels (comparing to Dec 2019)
– GTHA average is 40% of pre-COVID levels
• Jan 2021, after the 2nd second Provincial Lockdown, ridership was ~44% of pre-COVID levels (as of Jan 24, 2021)
– Adult ridership down to 56% of pre-COVID levels
– Seniors, Students, and Children ridership down to less than 30% of pre-COVID levels

Discover more from Burlington Gazette - Local News, Politics, Community
Subscribe to get the latest posts sent to your email.

There was no one on the buss’s before Covid but its worse now , yet the city has to have more of them on the road because of social distancing!? Dosen’t make sense