


 By Staff
June 26th, 2020
BURLINGTON, ON
We are holding our own – but there are situations that are falling between the cracks.
We know that this virus, COVID19, is passed from person to person.
That means we have to be vigilant about who we spend out time with – we don’t always know where they have been.
And – wash your hands and when you are out – wear a mask.
Here is the data. All the data can be found HERE.
We have passed along excerpts – they make the point and tell the story. For a deeper dive into the week – click on the link above.

Figure 1
Figure 1: COVID-19 cases, by episode date, Halton Region, Mar. 1-Jun. 24, 2020
Individuals who are lab-confirmed cases are shown in green. Individuals who are probable cases are shown in orange. Probable cases are individuals presumed to have COVID-19 because they have symptoms of COVID-19 and are travelers returning from an affected area, have had close contact with a confirmed case and/or lived/worked in a facility experiencing a COVID-19 outbreak, or have indeterminate test results.

Figure 3
For each day, Figure 3 shows the average number of new confirmed COVID-19 cases over the past seven days, including only those cases that are not staff or residents/patients associated with an outbreak in an institutional or congregate care setting. Cases have been graphed according to their collection date, which is the date that a sample was taken from them to be tested for COVID-19. The graph suggests that the average number of new cases per day was highest in late March/early April, with another increase in mid-May. Counts for recent days should be interpreted with caution (indicated using the grey shaded area on the graph), since there is a delay between when a person is tested and when their test results are reported to Public Health and entered into the system.
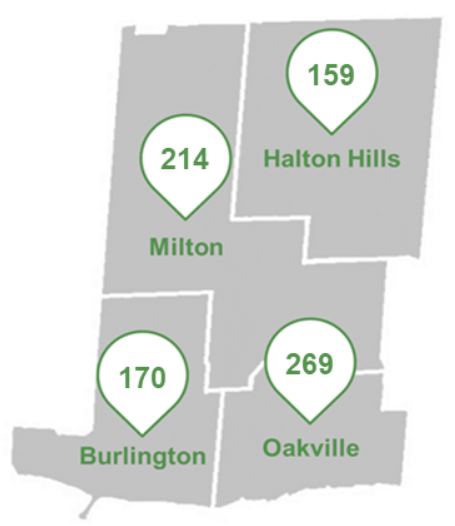
Figure 5
Figure 5 shows that by end of the day on June 24, the greatest number of COVID-19 cases were among residents of Oakville (with 269 cases, or 33%). Please note this figure shows counts, and therefore does not take into account the different population sizes or age structures of the four municipalities. Counts in municipalities can also be inflated by outbreaks that have occurred within institutions in their boundaries.
Up until very recently Burlington has had the lowest infection rate in the Region. Halton Hills is a much smaller municipality which would account for the lower number.
People are now getting out more – enjoying the nice weather. We can keep the infections low if we are careful.

Figure 10
The green bars in Figure 10 show the number of Halton residents who were tested for COVID-19 each week, beginning the week of March 1-7. Data for the most recent week (June 14-20) is incomplete due to reporting lags. The number of people tested decreased the week of May 17 compared to past weeks as mass testing of institutional residents was completed. The number of people tested then began to increase again, as the provincial government permitted more widespread testing.
The orange line in Figure 10 indicates the percentage of tested Halton residents who were positive for COVID-19. The percent positivity was highest the week of April 5-11, when 10.3% of Halton residents who were tested for COVID-19 had positive results. In the most recent week (June 14-20), 0.5% of people tested for COVID-19 tested positive, although this number is subject to reporting delays.
The rest of the world – not a pretty picture:

Discover more from Burlington Gazette - Local News, Politics, Community
Subscribe to get the latest posts sent to your email.
