


 By Pepper Parr
November 27the 2020
BURLINGTON, ON
The Region of Halton held a very lengthy meeting yesterday.
One of the reports they responded to was an update from Dr. Hamidah Meghani who produced a number of charts that were on the mind boggling level.
Have a look:
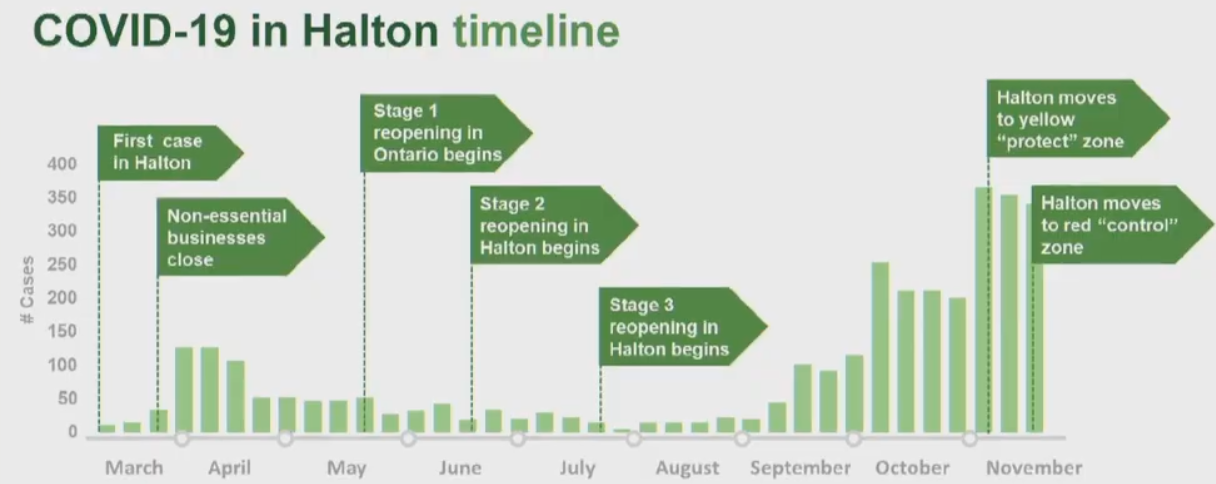
Dr. Meghani set out a time line showing her audience what we have been through.
The slope of the graph in October and November was very troubling for the medical community. They found that the public was not listening to the steps they had to take – daily.
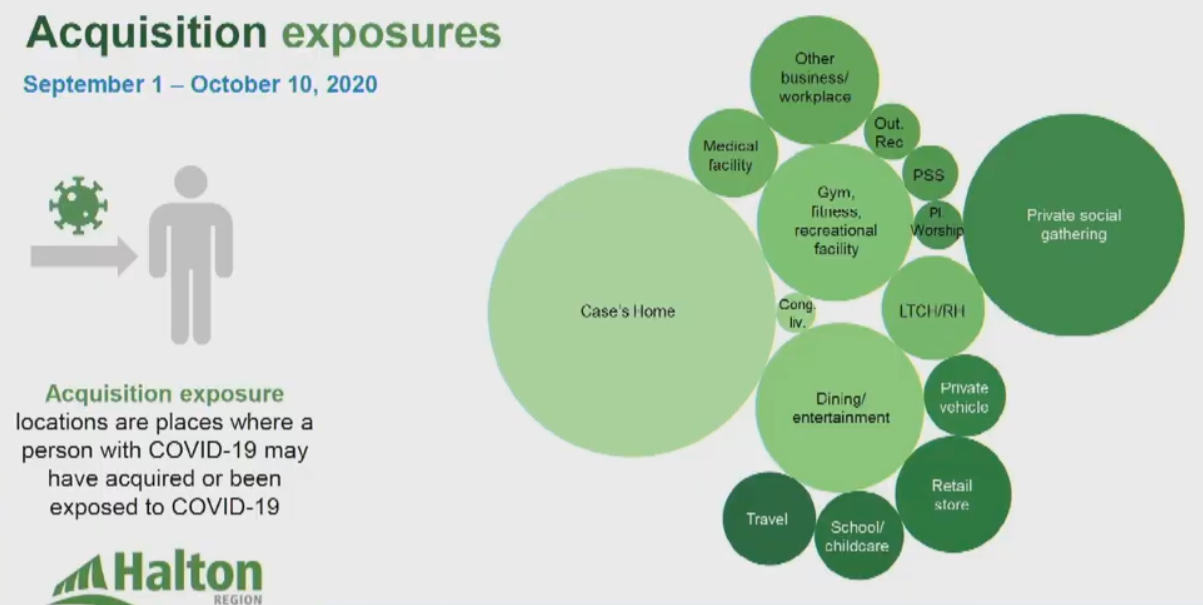
Where were people getting the infections? Dr. Meghani told her audience that the virus was not being passed around at the school level. Students were bringing it to the schools from their homes.
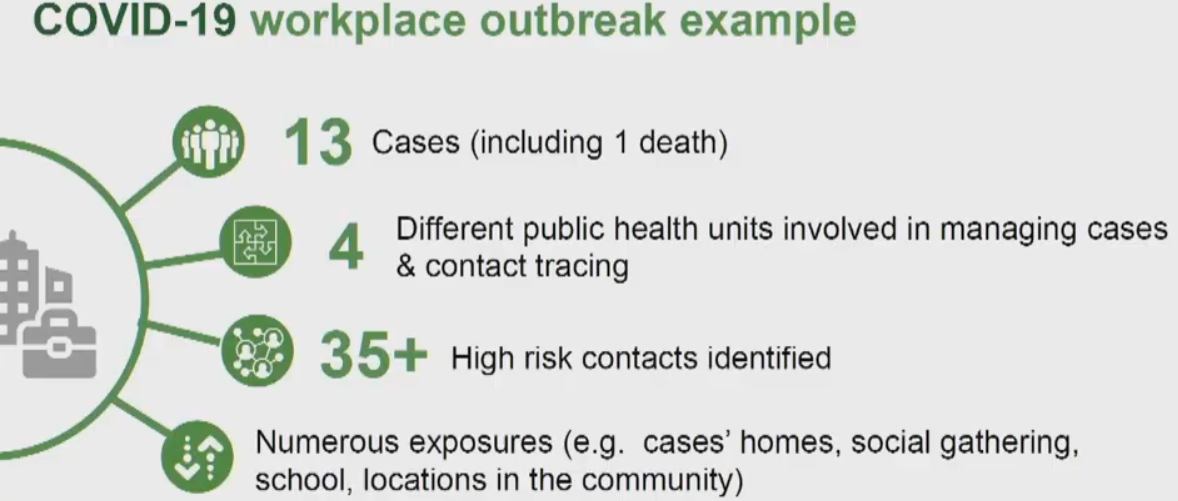
There were a number of workplace outbreaks in Halton. One impacted people who lived in four different Public Health jurisdictions. Tracing at that level of complexity proved to be a major challenge.
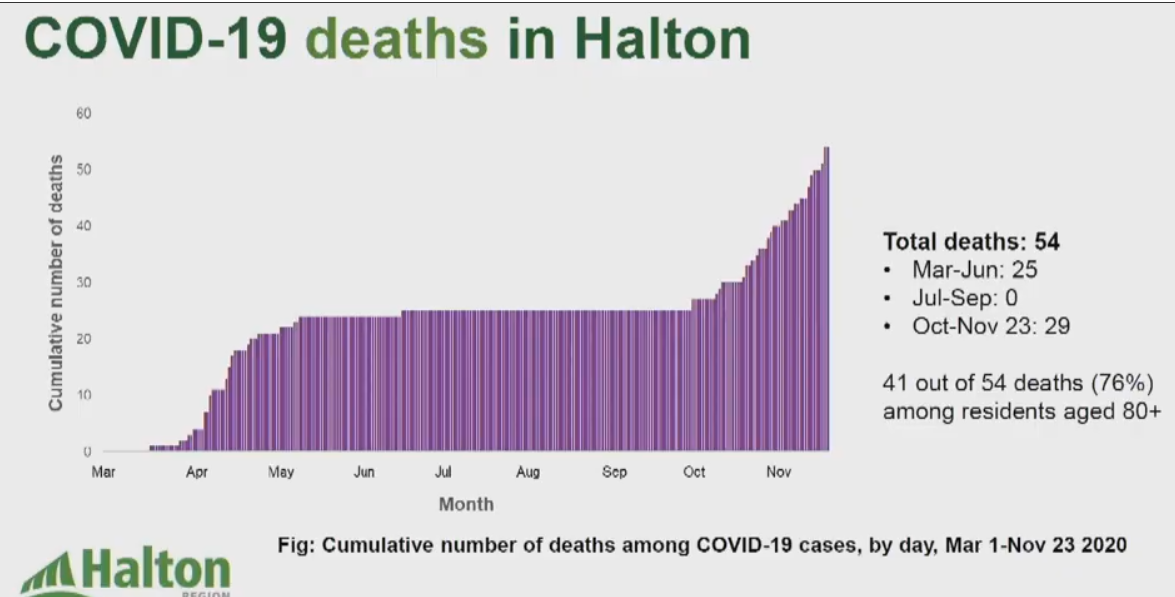
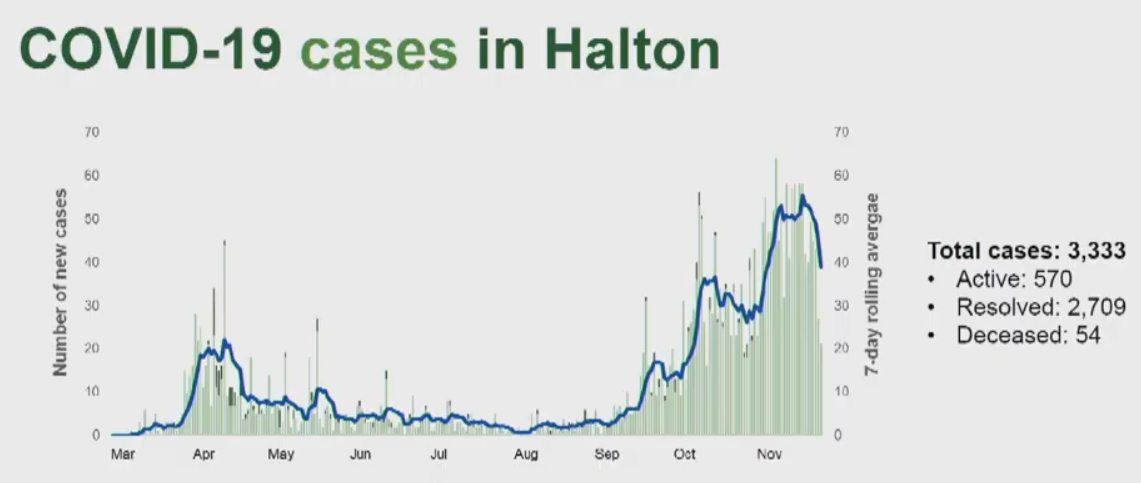
There is something so very stark about this graph. Deaths were close to flat from May to October – then they sky-rocked. Those deaths were due to a society that would not exercise the personal discipline needed by everyone during a crisis.

Discover more from Burlington Gazette - Local News, Politics, Community
Subscribe to get the latest posts sent to your email.

We didn’t do anything we weren’t told to do.
The government has dropped the ball at all levels.
Take a good look at the charts, remember back in March when “Masks don’t protect you.”?
How about when Masks were mandated in August? Now nearly everyone is wearing a mask and look at the numbers.
It looks as though they were right about the masks
Take a drive around and look at the messaging, each Municipality has their own China Virus reference site.
Couldn’t we all just use one single spot to get our information from?
Big box stores can open but independents can’t.
Perhaps membership has its privilege?