By Pepper Parr
BURLINGTON, ON. It wasn’t hard to figure out what the major message was behind the 2013 version of Burlington’s Vital Signs report is: there are many in the community who just don’t have enough – and it isn’t just the “poor” people that are going without.
The Burlington Community Foundation, around since 1999, released, along with 26 other communities across Canada, a report that touched all the usual bases and added in a significant push on the pressing needs for better access to mental health services.
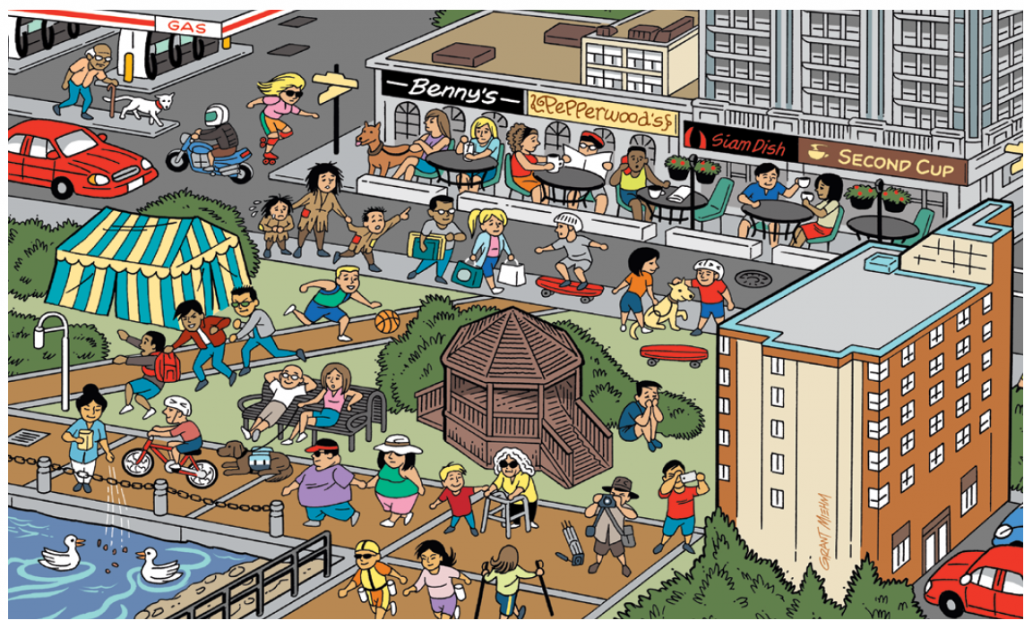
The Vital Signs report is data driven and uses graphics very effectively to make the point. The cartoon cover page is Burlington: there’s the gazebo (I met my wife for the first time there) there’s Pepperwoods, there is Benny’s and the gas station. The drawings are all in colour and attractive in their own way. Cute – it isn’t until you get to the second page that the point is made. Well – compare the two versions and you know in an instant what the report wants to talk about.
The report is the second published by the Community Foundation. The 2013 report covers eleven key areas of focus, including physical and mental wellness, poverty, youth, and seniors.
“This year’s report again emphasizes that Burlington is a city of contrasts. We are a prosperous community, with higher than average levels of income and education, with remarkable environmental features such as our escarpment and waterfront. Yet, there are people struggling in our community, in ways that are often unseen, as we drive and walk through our neighbourhoods”, said Burlington Community Foundation (BCF) President and CEO, Colleen Mulholland.
Who are the people that collect all the data and tie the different strands that are woven into the tapestry that is our city?
Established in 1999 as a centre for philanthropy, Burlington Community Foundation is a local knowledge broker and one of the most reliable partners in the non-profit sector. They collaborate with donors to build endowments, give grants and connect leadership. Responsive to their donors, the grant making experts help people give, build legacies, address vital community needs and support areas of personal interest. The Foundation helps people, agencies and corporations improve the city’s vitality.
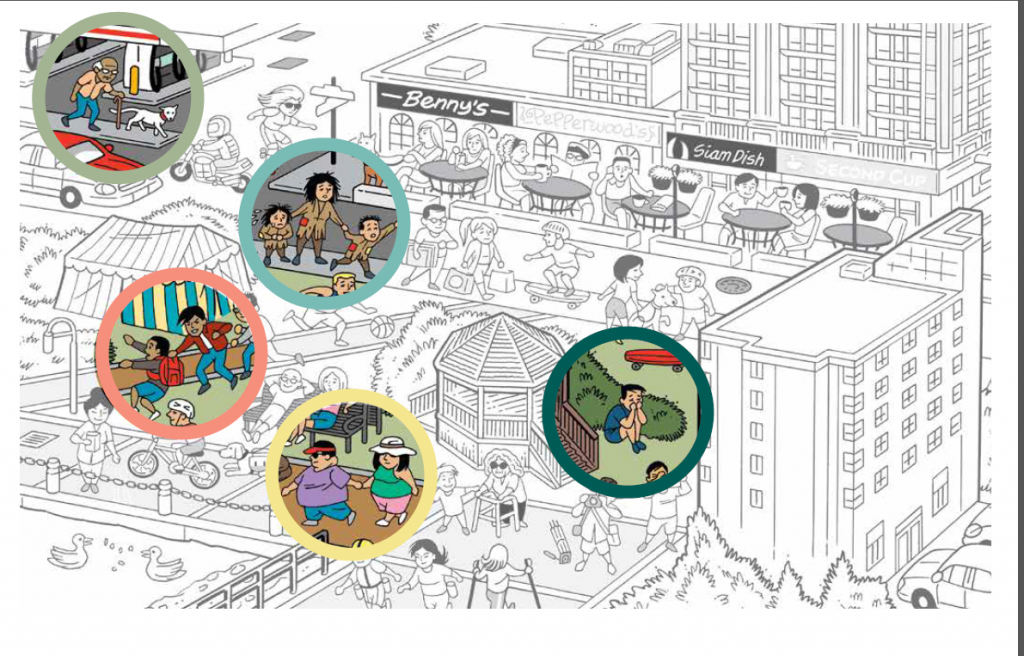
Take away the good stuff, the nice stuff and the picture is that of a different Burlington – not one we all get to see.
The report argues that “connections are critical to community vitality” but how do you do that? You’ve heard it before and with a municipal election just over a year away you will hear it again from every one of the rascals running for office: – Burlington is ranked as the top mid-sized city in which to live in Canada.
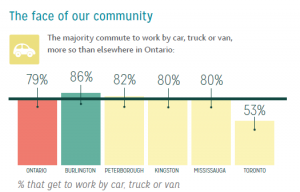
We drive – everywhere, in part because local transit has yet to develop to the point where it serves the community as well as it is going to have to. Biggest reason – we like our cars.
And we drive our cars – to everything. 79% of Ontarian’s commute to work by car, truck or van. That number is 86% for Burlington where we have an excellent, frequent train service that has three stops in the city with plenty of parking – free.
We vote – in the last federal election 66.5 of us voted while the Ontario average was 61.5%. Didn’t do much for us in terms of the quality of our elected members though did it?
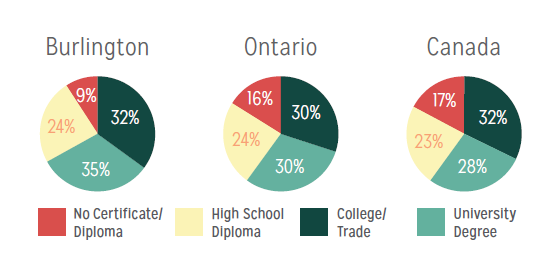
We are a well-educated community – check out the charts.
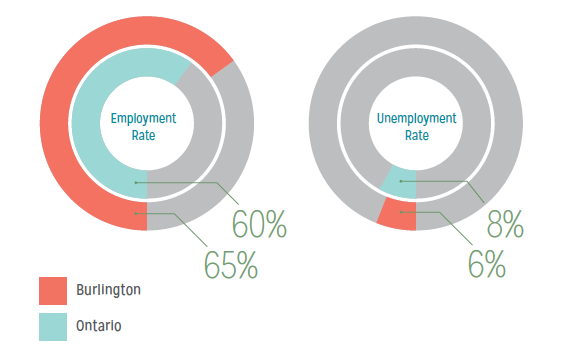
Burlington is doing better at both the number of people with jobs and the number that are unemployed. But there are other indicators that reveal serious problems.
Our people are employed – they need to be – our housing is amongst the most expensive in the province and rental accommodation is not easy to come by.
Median household income levels are 24% higher in Burlington than the provincial average but according to Statistics Canada, almost 1 in 10 youth under 18 lived in a low-income household.
In 2012, 36% of all items circulated by Burlington public libraries were in the child or youth category. Attendance at children and youth programs at Burlington libraries was 35,195.
Overall, the age profile of Burlington is getting older and more so than the Ontario average – in 2011, there were 29,720 seniors 65 years of age or older living in Burlington, comprising 16.9% of the population vs. 14.6% in Ontario.
Young people in Burlington are preforming well in school compared to the Ontario average but there are some opportunities for improving the lives and outcomes for our youth, starting as early as kindergarten. Some issues we need to tackle as a community are obesity, bullying and mental health.
Burlington residents are better educated than the population of Ontario and Canada. 67% of Burlington adults 25 years of age and over have completed some form of post-secondary education, compared with 60% of the population of Ontario.
Among Burlingtonians 25–64 years of age, 95% have completed high school – this is a big positive change in a 10 year period: in 2001, 79% had completed high school.
In 2011, there were 143,510 people 15 years of age or older in Burlington. Within this age range, 93,030 people were employed and 5,755 were unemployed for a total labour force of 98,785.
Burlington has stronger employment statistics than Ontario as a whole. The employment rate among people 15–64 years of age was 65%, compared to 60% for Ontario. Burlington’s unemployment rate was 6%, compared to 8% for Ontario.
For the past 10 years, the rate of unemployment in Burlington has been consistently lower than elsewhere in Ontario and in other communities across Canada.
Here are some quick facts about jobs and businesses in Burlington, according to the Halton Region 2012 Employment Survey, released in June 2013:
The City of Burlington has 4,638 businesses providing 74,216 full and part-time jobs.
While Burlington accounts for 35% of the 15–64 year olds living in Halton Region, jobs in Burlington accounted for nearly 40% of Halton’s total employment.
Approximately 80% of jobs were in the service-based sector – the leading ones being the retail trade, professional, scientific and technical services, and health care and social assistance.
Air quality good – but could be better
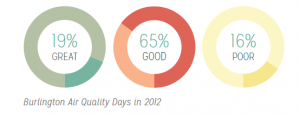
Burlington has good air quality, compared to downtown Hamilton. Hamilton has more poor to moderate air quality days (22%) than does Burlington (16%).
However, Burlington’s location in southern Ontario – in Canada’s manufacturing heartland and downwind from the industrial centre of the U.S. – increases the number of poor to moderate air quality days relative to more northern parts of Ontario and cities in other parts of Canada. For example, in each of Sudbury and Ottawa only 8% of the days in 2012 had poor to moderate air quality compared to 16% in Burlington.
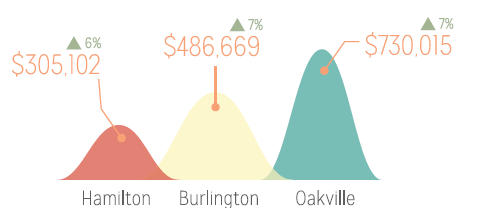
The average price of a home in Burlington in the first half of 2013 was $486,669 – up 7% from 2012.
Similar increases were seen in the neighbouring cities of Hamilton (+6%) and Oakville (+7%), with Burlington housing costs continuing to be intermediate between these two cities
Burlington’s rental market is tight – far too tight. The city thought it had a hope recently with close to 100 affordable units coming on line – but that one got away on us.
People looking to rent – particularly those with more modest incomes – can find it difficult to find affordable rental housing in Burlington. In fall 2012, Burlington’s rental vacancy rate was 1.3%. For reference, a vacancy rate of 3% is considered necessary for adequate competition and supply. By comparison, Hamilton’s vacancy rate was 4.2%, and in Ontario as a whole it was 2.5%.
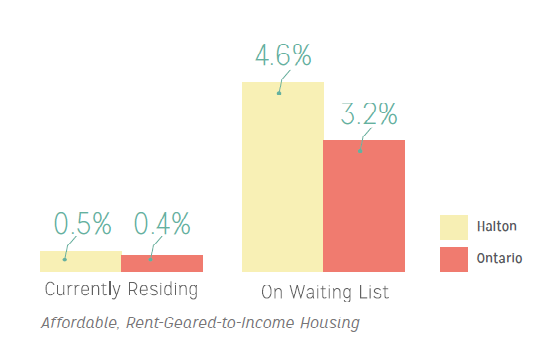
In 2011, Halton had a higher percentage of households (4.6%) on waiting lists for affordable, rent geared-to-income housing than was the case for Ontario as whole (3.2%). Further, the demand for this housing greatly exceeds the supply, as only 0.5% of Halton households were living in affordable, rent- geared-to-income housing in 2011.
In Halton, between 2010 and 2011 there was a 47% increase in households waiting for rent-geared-to-income housing. Families with children are the hardest hit.
Residents of Halton are more likely to rate their overall health as “very good” or “excellent” (72%) compared with Ontario residents as a whole (61%). Moreover, positive health ratings increased from 2011 (66%) to 2012 (72%).
Over 75,000 Burlington residents 18 years of age and older are overweight or obese based on their self-reported height and weight. That’s just over half of the adult population who have an increased risk of certain health problems, including Type 2 diabetes, hypertension, coronary heart disease, gallbladder disease, obstructive sleep apnea, and certain cancers.
Mental health is now at least being talked about – it isn’t something we hide the way we used to – that was an improvement for the better. Now we have to address the problem and it is not going to be cheap.
 The Canadian Institute for Health Information tracks the performance of over 600 health care facilities across Canada on a variety of indicators of effectiveness of treatment, patient safety, appropriateness of treatment, and accessibility. JBH is either at or better than the Canadian average on all of the indicators.
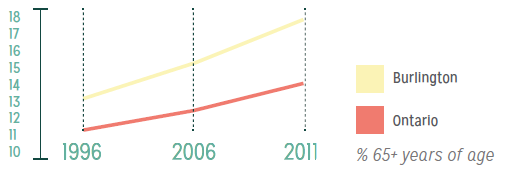
Seniors need different services. The city currently has one Seniors’ Centre and at least five high schools. Will we need additional Seniors’ Centers that can be converted to high schools 30 years down the road? There are some significant problems to need solutions and we don’t have a lot of time to find the answers.
Canada’s age profile is getting older, and this trend will continue for several decades into the future. For example, the proportion of people 65+ years of age in Ontario is expected to grow from 14.6% of the population in 2011 to over 23% by the year 2036.
Burlington’s age profile has historically been older than that of Ontario as a whole, and the difference has been increasing over time. As of 2011, 16.9% of Burlington’s population was 65 years of age or older, compared to 14.6% of Ontario’s population.
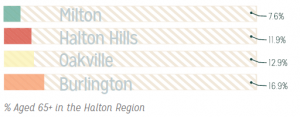
Burlington has more of the Region’s senior population – do we have well thought out plans to meet their needs?
Based on Statistics Canada measures of low-income from the 2006 census, 5.6% of Burlington seniors have low-income after tax. However, the prevalence of low-income is particularly acute among female seniors in Burlington: this prevalence is higher than the Ontario average, and higher than other Halton region communities.
In 2006, about 1,800 senior households in Burlington spent 30% or more of their total household income before tax on mortgages, electricity, heat and municipal services. Of these, almost 500 spent 50% or more of their income on housing, which leaves very little money for food, medications, or other necessities.
In the Age-Friendly Communities Forum: A Seniors’ Perspective – an initiative of the Elder Services Advisory Council In Halton Region – the Burlington participants identified a need for affordable housing as one of the top 3 issues for seniors in Burlington, and noted that “some people are moving out of the community as they cannot afford to live here.”
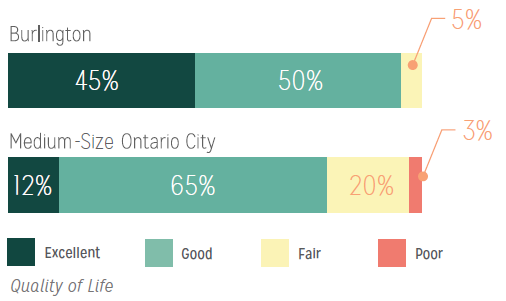
Burlington residents tend to see the quality of life in the city as improving: 27% said the quality of life in Burlington has improved over the past two years, compared to only 11% who said it has declined.
Survey respondents were asked which factors had the greatest impact on quality of life in their city. What set Burlington residents apart particularly was the importance of a low crime rate, and a strong sense of community.
In a survey of Burlington residents, 76% said culture is “essential” or “highly important” in their daily lives. There are many types of cultural experiences. For Burlington residents, the top 6 are festivals (86%), museum & local history (81%), art galleries (78%), going to the theatre (75%), public art (69%) and family heritage & traditions (69%).
Benefits to Burlington from community cultural organizations include:
624,000+ visits to local festivals, events, productions and exhibitions
89,000+ hours of cultural programming offered to all ages
Burlington residents spend 37% of their cultural time in Burlington, and the remaining time in other cities such as Toronto and Hamilton.
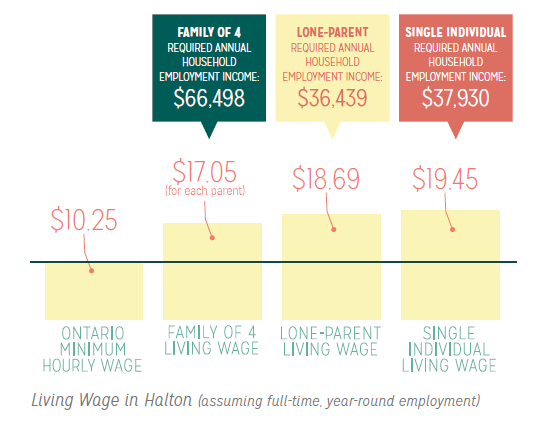
These numbers are the reality for many. A person cannot live on the minimum wage – it has to be close to doubled – and that’s not something a municipality can do.
Ontario has a legally mandated minimum wage of $10.25 an hour. However, a person working full-time at the minimum wage rate will be living in poverty, as they will earn less than Statistics Canada’s Low Income Cut-off.
The concept of a “living wage” is motivated by the following question: What does a family working full-time (37.5 hours a week, year-round) need to earn in order to pay for the necessities of life, to enjoy a decent quality of life, and to be able to participate fully in the economic, political, social and cultural life of the community?
The answer to this question depends on family composition and on where you live. Community Development Halton has tackled this question for the Halton Region, including Burlington.
What is included in a living wage, and what is excluded? “A living wage isn’t extravagant. It doesn’t allow families to save for retirement, to save for their children’s education or to service their debt. But it does reflect the cost of affording the basics of life – something the minimum wage doesn’t do,” states the Canadian Centre for Policy Alternatives.
Community Development Halton considered three types of Halton households: a family of 4 (two parents, two children – a boy age 10, and a girl age 14), a single-parent family (mother age 30 and a boy age 3), and a single person (male age 32). In each household, each adult is working full- time, year-round. The calculation of living wage reflects the typical costs in Halton, as well as taxes and benefits.
The number of youth in Burlington has increased since 2006, but at a slower rate than older age groups. As a result, the overall age profile of Burlington is getting older.
Burlington is an affluent community, but not everyone is well off. In the 2006 census, 7% of all residents lived in low income households. However, this was greater for youth under 18, where 9% – almost one in 10 youth – lived in a low income household.
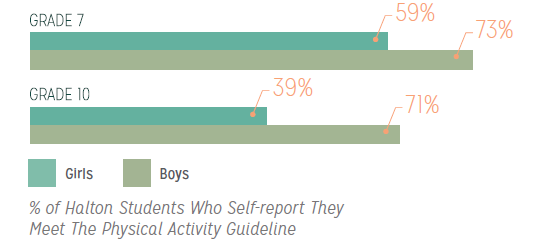
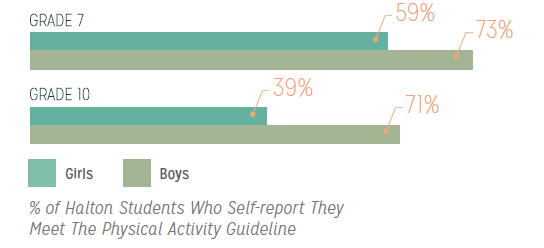
This is what students have said they did in terms of getting the physical education they need for balanced growth.
According to the Canadian Society for Exercise Physiology, youth 12–17 years of age require at least 60-minutes of moderate to vigorous intensity activity per day.
In the Halton Youth Survey, two–thirds of Burlington Grade 7s claimed to meet the 60-minute-per-day guideline, but only just over half of Grade 10s claimed to meet the guideline.
Girls in the Halton region were much less likely than boys to report meeting the physical activity guideline, with only four in ten Grade 10 girls meeting the guideline.
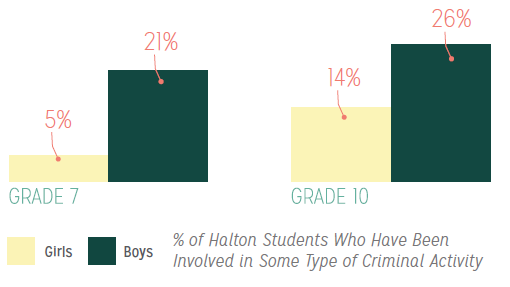
The Halton Youth Survey, conducted by the Halton Our Kids Network, developed an indicator of involvement in criminal activity based on four self- report questions asking about vandalism, carrying a weapon, selling drugs, and group or gang involvement, and these define what is meant here by “criminal activity”. Note that because this is based on self-report, it includes not only youth accused of crime but also youth who “got away with it”.
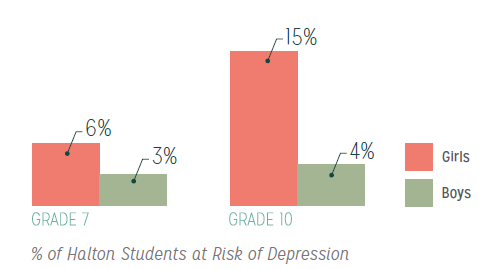
Our girls are at very serious risk: do we understand why and do we have programs to help them deal with the depression they are experiencing?
One in five people in Ontario experiences a mental health problem or illness. Because mental illness can affect people in all walks of life, this is as important an issue in comparatively affluent communities like Burlington as it is in other less affluent communities. When you take into account family members and friends, almost everyone is affected in some way.

Mental illness affects people at all life-stages. However, one of the most significant characteristics of the onset of mental health problems is that, unlike many other illnesses, they are more likely to first emerge and affect people early in their lives.
According to a Mental Health Commission of Canada report, the potential negative effects of mental illness on the lives and prospects of young people are considerable:
“Mental disorders are the most common medical conditions causing disability in young people. Most mental disorders begin before age twenty- five and tend to be chronic, with substantial negative short and long-term outcomes. They are associated with poor academic and occupational success, economic burden, personal, interpersonal and family difficulties, increased risk for many physical illnesses and shorter life expectancy.”
Early detection and treatment of mental health problems is vital for the young people in our community and for the future health of our city.
 Access to youth mental health services is not what it needs to be
Only one-third of those who need mental health services in Canada actually receive them.
71% of family physicians ranked access to psychiatrists in Ontario as fair to poor.
While mental illnesses constitute more than 15% of the burden of disease in Canada, these illnesses receive only 5.5% of health care dollars.
ROCK reports that due to mental health funding gaps, as of March 2013, youth and families were waiting for just over 1,000 various services they offer. Wait times for these services range from months up to 2 years.
Suicide is the second leading cause of death among young people in Canada. One of the most important causes of youth suicide is mental illness – most often depression, bipolar disorder, schizophrenia, and substance abuse.
The effects of youth suicide go beyond the deceased, impacting those who survive their death – their parents, friends, peers, and communities.
A survey conducted by the Centre for Addiction and Mental Health found that in response to the question, “In the last 12 months, did you ever seriously consider attempting suicide?”, 7% of Ontario Grade 7s and 12% of Grade 12s answered “yes.”
The Halton Youth Survey asked a somewhat different version of the question, focusing on teens who “sometimes, often or always” had thoughts of suicide in the past 12 months. While the question is somewhat different the results are similar: one in twenty (5%) Grade 7s in Burlington had thoughts about suicide in the past 12 months, increasing to over one in ten (13%) by Grade 10.
Depression is a mood disorder characterized by intense negative emotions and feelings, that negatively impact on people’s lives leading to social, educational, personal and family difficulties.
The Halton Youth Survey created an indicator of being at risk for depression, based on a person saying they “always” or “often” had experienced the following four emotional states in the past week: feeling sad, lonely, depressed, or like crying.
The percentage of Burlington students at risk for depression increases from Grade 7 to Grade 10, and by Grade 10, one in 10 teens are at risk for depression.
This increase in risk for depression from Grade 7 to Grade 10 is occurring primarily among girls. By Grade 10, one in seven girls is at risk for depression.
In the qualitative research project, Halton Youth Voice Road Show (2011), participants suggested the following causes for depression in youth:
Being bullied, which was seen to lead not only to depression but also suicide
Different social groups within a school bullying one another
The fact that sometimes youth were just mean to each other
Technology, since youth don’t actually need to connect to each other on a personal level any more
Images and expectations portrayed in the media
The pursuit of material possessions, with participants saying that it would be better if youth just spent time hanging out instead of shopping
Stress
Not having friends
Being pressured to do drugs
Youth mental health trends at Joseph Brant Hospital
Trips to the hospital emergency department because of a mental health issue represent the tip of the iceberg for youth mental health and substance abuse issues in Burlington. Emergency department visits can occur when mental health or substance abuse issues are undiagnosed, or are untreated, or treatment is not working. Youth visits to the JBH emergency department because of mental health or substance abuse problems show:
Emergency department visits for mental health or substance abuse issues spikes upwards for youth 18–24 years of age.
The annual number of youth under 25 years of age going to JBH emergency because of mental health or substance abuse issues has increased 30% over the last 3 years.
The rate of increase has been even higher among the subset of youth under 18 years of age – showing an increase in emergency visits of 43% over the past 3 years.
JBH operates the Child and Adolescent Psychiatry Consultation Clinic, which provides support to children/youth under the age of 18 years. The case load for the Clinic increased by 16% from 2010–11 to 2011–12, and the average wait time for assessment increased by 31%, to 47 days.
The Community Foundation serves us all well – now the community has to look at the data, talk about it and figure out where we can shore up the weak spots and ensure that we continue to do what we have done well.
Collen Mulholland plans to hold a Roundtable on Mental Health early in 2014. How about ensuring that every grade 10 student in the Board of Education’s high schools be given a copy and make it the focus of a civics class.


